THM: Walking An Application
Ref:
Task1: Introduction
Learn how to manually review a web application for security issues using only the in-built tools in your browser. More often than not, automated security tools and scripts will miss many potential vulnerabilities and useful information.
Here is a short breakdown of the in-built browser tools you will use throughout this room:
- View Source - Use your browser to view the human-readable source code of a website.
- Inspector - Learn how to inspect page elements and make changes to view usually blocked content.
- Debugger - Inspect and control the flow of a page’s JavaScript
- Network - See all the network requests a page makes. Start the virtual machine on this task, wait 2 minutes, and visit the following URL: https://LAB_WEB_URL.p.thmlabs.com (this URL will update 2 minutes from when you start the machine)
Task2: Exploring The Website
As a penetration tester, your role when reviewing a website or web application is to discover features that could potentially be vulnerable and attempt to exploit them to assess whether or not they are. These features are usually parts of the website that require some interactivity with the user.
Finding interactive portions of the website can be as easy as spotting a login form to manually reviewing the website’s JavaScript. An excellent place to start is just with your browser exploring the website and noting down the individual pages/areas/features with a summary for each one.
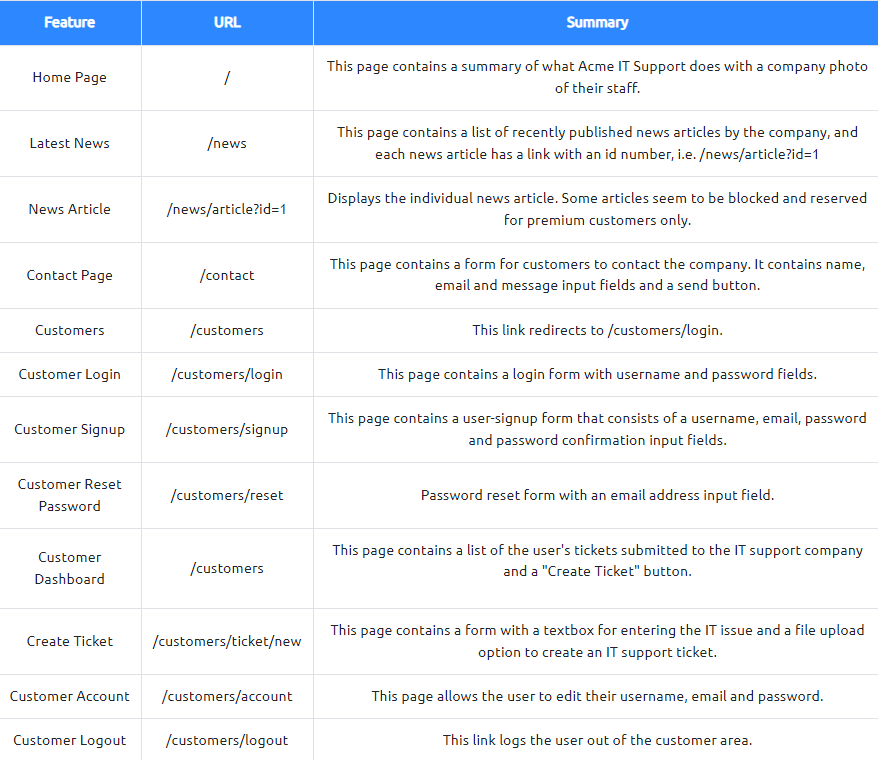
An example site review for the Acme IT Support website would look something like this:
Tasks3: Viewing The Page Source
The page source is the human-readable code returned to our browser/client from the web server each time we make a request.
The returned code is made up of HTML ( HyperText Markup Language), CSS ( Cascading Style Sheets ) and JavaScript, and it’s what tells our browser what content to display, how to show it and adds an element of interactivity with JavaScript.
For our purposes, viewing the page source can help us discover more information about the web application.
How do I view the Page Source?
While viewing a website, you can right-click on the page, and you’ll see an option on the menu that says View Page Source. Most browsers support putting view-source: in front of the URL for example, view-source:https://www.google.com/ In your browser menu, you’ll find an option to view the page source. This option can sometimes be in submenus such as developer tools or more tools.
Let’s view some Page Source!
Try viewing the page source of the home page of the Acme IT Support website. Unfortunately, explaining everything you can see here is well out of the scope of this room, and you’ll need to look into website design/development courses to understand it fully. What we can do, is pick out bits of information that are of importance to us.
At the top of the page, you’ll notice some code starting with <!-- and ending with -->these are comments. Comments are messages left by the website developer, usually to explain something in the code to other programmers or even notes/reminders for themselves. These comments don’t get displayed on the actual webpage. This comment describes how the homepage is temporary while a new one is in development. View the webpage in the comment to get your first flag.
Links to different pages in HTML are written in anchor tags ( these are HTML elements that start with <a ), and the link that you’ll be directed to is stored in the href attribute.
If you view further down the page source, there is a hidden link to a page starting with "secr", view this link to get another flag. You obviously wouldn’t get a flag in a real-world situation, but you may discover some private area used by the business for storing company/staff/customer information.
External files such as CSS, JavaScript and Images can be included using the HTML code. In this example, you’ll notice that these files are all stored in the same directory. If you view this directory in your web browser, there is a configuration error. What should be displayed is either a blank page or a 403 Forbidden page with an error stating you don’t have access to the directory. Instead, the directory listing feature has been enabled, which in fact, lists every file in the directory. Sometimes this isn’t an issue, and all the files in the directory are safe to be viewed by the public, but in some instances, backup files, source code or other confidential information could be stored here. In this instance, we get a flag in the flag.txt file.
Many websites these days aren’t made from scratch and use what’s called a framework. A framework is a collection of premade code that easily allows a developer to include common features that a website would require, such as blogs, user management, form processing, and much more, saving the developers hours or days of development.
Viewing the page source can often give us clues into whether a framework is in use and, if so, which framework and even what version. Knowing the framework and version can be a powerful find as there may be public vulnerabilities in the framework, and the website might not be using the most up to date version. At the bottom of the page, you’ll find a comment about the framework and version in use and a link to the framework’s website. Viewing the framework’s website, you’ll see that our website is, in fact, out of date. Read the update notice and use the information that you find to discover another flag. Answer the questions below
What is the flag from the HTML comment?
1
2
3
view-source:https://10-10-185-187.p.thmlabs.com/new-home-beta

THM{HTML_COMMENTS_ARE_DANGEROUS}
What is the flag from the secret link?
1
view-source:https://10-10-185-187.p.thmlabs.com/secret-page
What is the directory listing flag?
1
2
3
view-source:http://10-10-185-187.p.thmlabs.com/assets/flag.txt

THM{INVALID_DIRECTORY_PERMISSIONS}
What is the framework flag?
1
2
3
view-source:https://10-10-185-187.p.thmlabs.com/tmp.zip

THM{KEEP_YOUR_SOFTWARE_UPDATED}
Task4: Developer Tools - Inspector
Developer Tools
Every modern browser includes developer tools; this is a tool kit used to aid web developers in debugging web applications and gives you a peek under the hood of a website to see what is going on. As a pentester, we can leverage these tools to provide us with a much better understanding of the web application. We’re specifically focusing on three features of the developer tool kit, Inspector, Debugger and Network.
Opening Developer Tools
The way to access developer tools is different for every browser. If you’re not sure how to access it, click the “View Site” button on the top right of this task to get instructions to how to access the tools for your browser.
Inspector
The page source doesn’t always represent what’s shown on a webpage; this is because CSS, JavaScript and user interaction can change the content and style of the page, which means we need a way to view what’s been displayed in the browser window at this exact time. Element inspector assists us with this by providing us with a live representation of what is currently on the website.
As well as viewing this live view, we can also edit and interact with the page elements, which is helpful for web developers to debug issues.
On the Acme IT Support website, click into the news section, where you’ll see three news articles.
The first two articles are readable, but the third has been blocked with a floating notice above the content stating you have to be a premium customer to view the article. These floating boxes blocking the page contents are often referred to as paywalls as they put up a metaphorical wall in front of the content you wish to see until you pay.
Right-clicking on the premium notice ( paywall ), you should be able to select the Inspect option from the menu, which opens the developer tools either on the bottom or right-hand side depending on your browser or preferences. You’ll now see the elements/HTML that make up the website ( similar to the screenshots below ).
Locate the DIV element with the class premium-customer-blocker and click on it. You’ll see all the CSS styles in the styles box that apply to this element, such as margin-top: 60px and text-align: center. The style we’re interested in is the display: block. If you click on the word block, you can type a value of your own choice. Try typing none, and this will make the box disappear, revealing the content underneath it and a flag. If the element didn’t have a display field, you could click below the last style and add in your own. Have a play with the element inspector, and you’ll see you can change any of the information on the website, including the content. Remember this is only edited on your browser window, and when you press refresh, everything will be back to normal.
What is the flag behind the paywall?
1
2
3
4
5

THM{not_so_hidden}
Task5: Developer Tools - Debugger
Developer Tools - Debugger
This panel in the developer tools is intended for debugging JavaScript, and again is an excellent feature for web developers wanting to work out why something might not be working. But as penetration testers, it gives us the option of digging deep into the JavaScript code.
In Firefox and Safari, this feature is called Debugger, but in Google Chrome, it’s called Sources.
On the Acme IT Support website, click on the contact page, each time the page is loaded, you might notice a rapid flash of red on the screen. We’re going to use the Debugger to work out what this red flash is and if it contains anything interesting. Debugging a red dot wouldn’t be something you’d do in the real world as a penetration tester, but it does allow us to use this feature and get used to the Debugger.
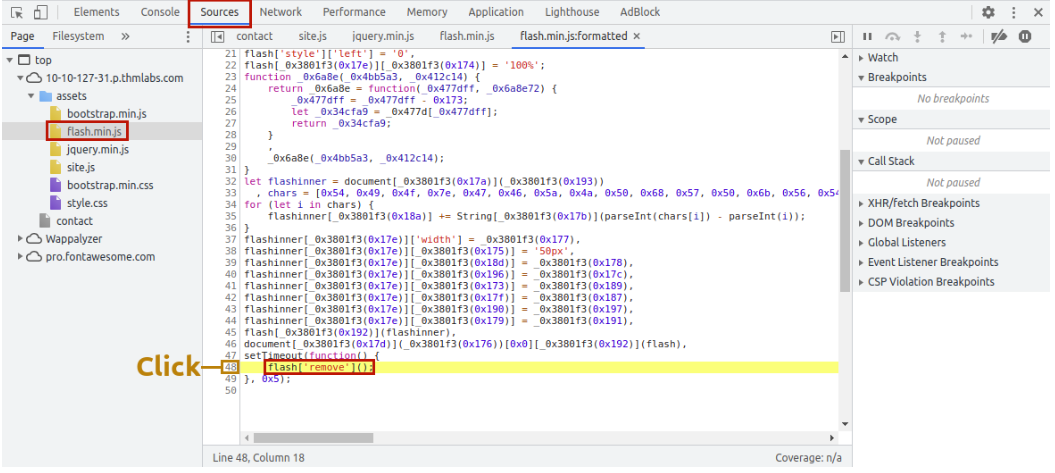
In both browsers, on the left-hand side, you see a list of all the resources the current webpage is using. If you click into the assets folder, you’ll see a file named flash.min.js. Clicking on this file displays the contents of the JavaScript file.
Many times when viewing javascript files, you’ll notice that everything is on one line, which is because it has been minimised, which means all formatting ( tabs, spacing and newlines ) have been removed to make the file smaller. This file is no exception to this, and it has also been obfusticated, which makes it purposely difficult to read, so it can’t be copied as easily by other developers.
We can return some of the formattings by using the “Pretty Print” option, which looks like two braces { } to make it a little more readable, although due to the obfustication, it’s still difficult to comprehend what is going on with the file. If you scroll to the bottom of the flash.min.js file, you’ll see the line: flash['remove']();
This little bit of JavaScript is what is removing the red popup from the page. We can utilise another feature of debugger called breakpoints. These are points in the code that we can force the browser to stop processing the JavaScript and pause the current execution.
If you click the line number that contains the above code, you’ll notice it turns blue; you’ve now inserted a breakpoint on this line. Now try refreshing the page, and you’ll notice the red box stays on the page instead of disappearing, and it contains a flag.
What is the flag in the red box? 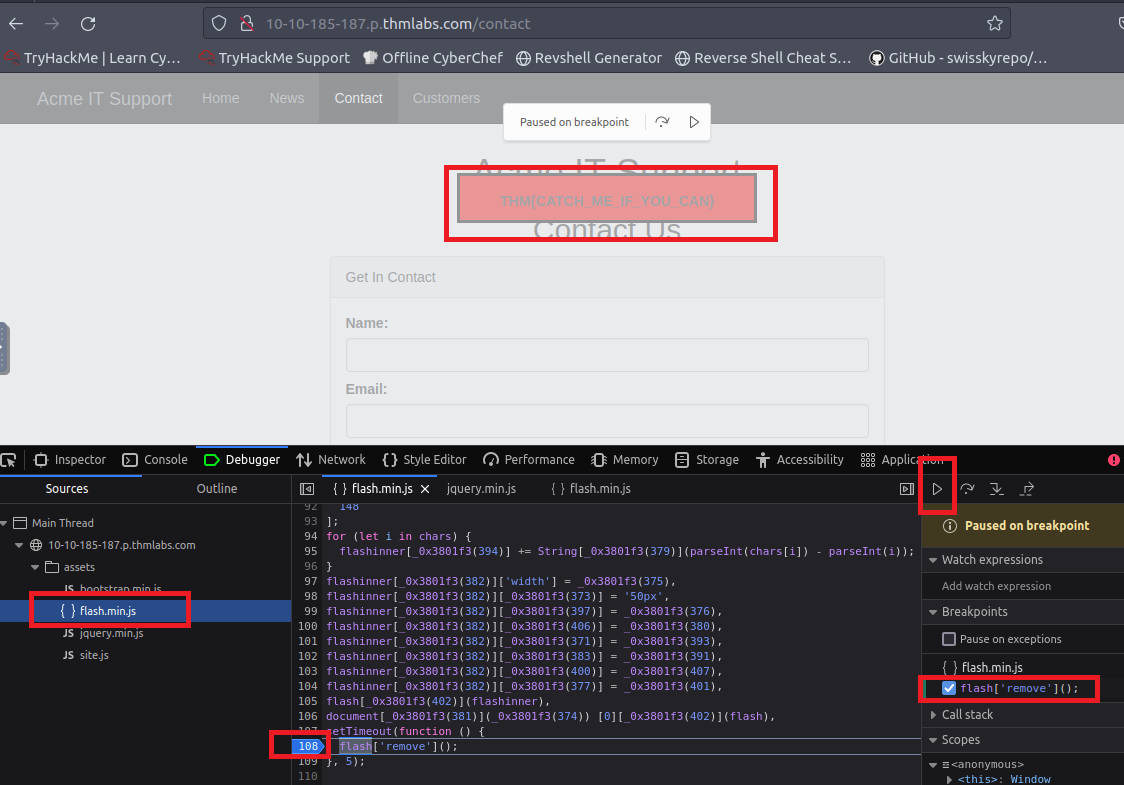
1
THM{catch_Me_If_you_can}
Task6: Developer Tools - Network
Developer Tools - Network
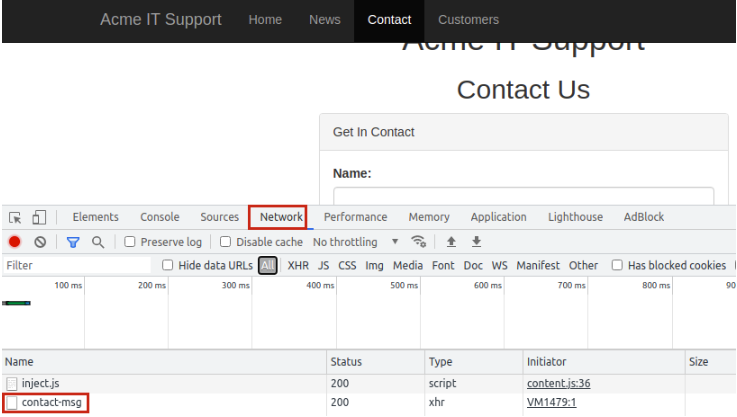
The network tab on the developer tools can be used to keep track of every external request a webpage makes. If you click on the Network tab and then refresh the page, you’ll see all the files the page is requesting.
Try doing this on the contact page; you can press the trash can icon to delete the list if it gets a bit overpopulated.
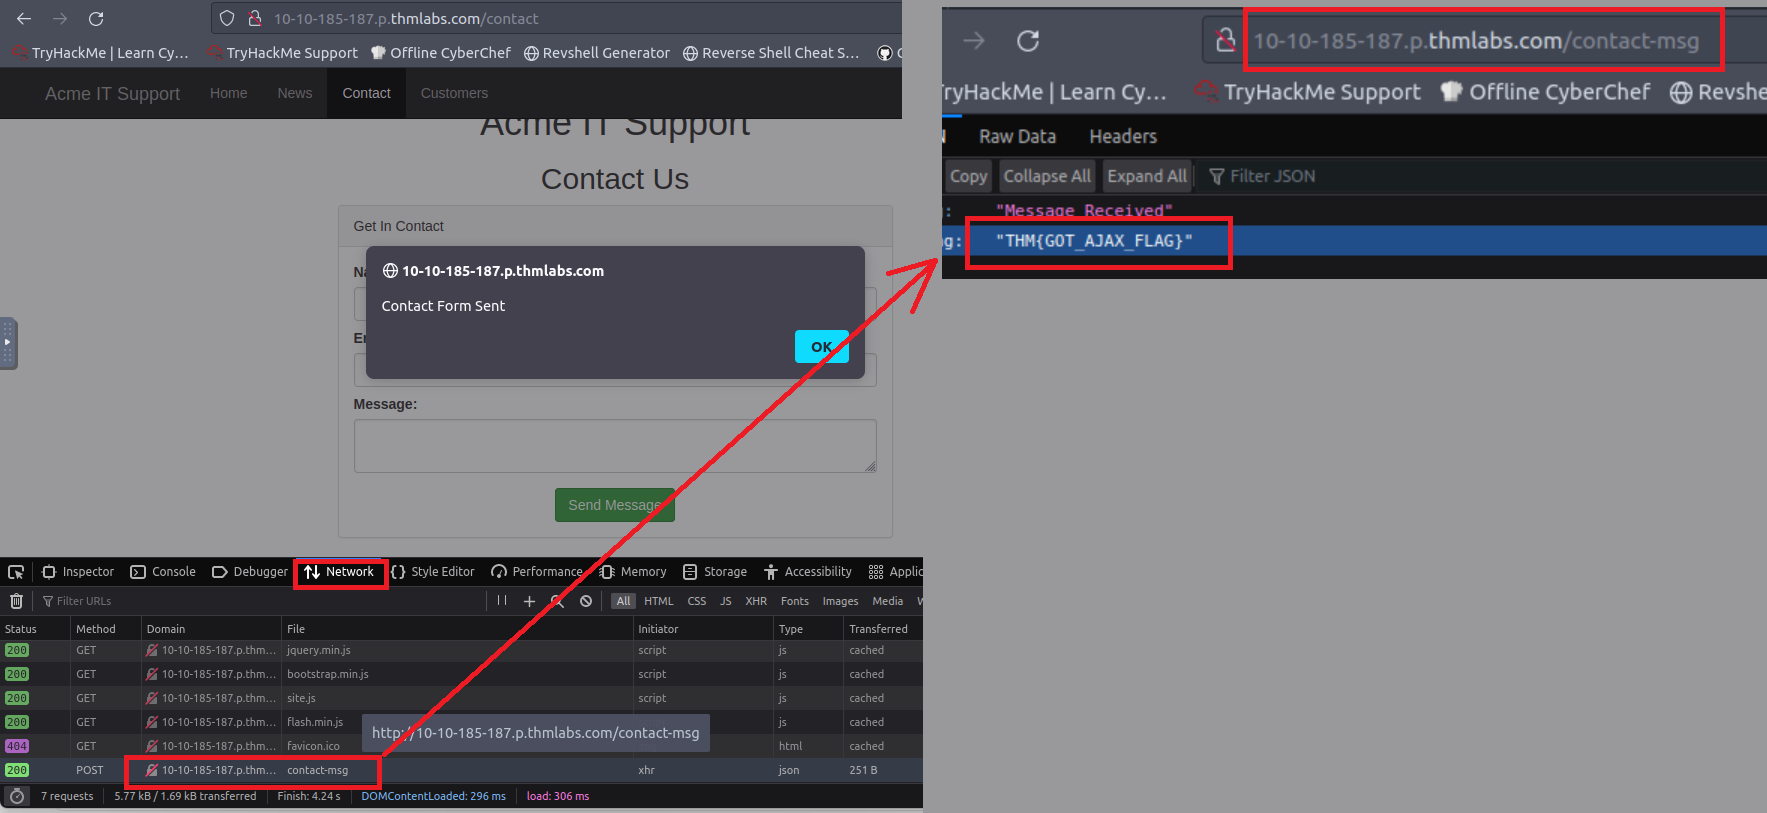
With the network tab open, try filling in the contact form and pressing the Send Message button. You’ll notice an event in the network tab, and this is the form being submitted in the background using a method called AJAX. AJAX is a method for sending and receiving network data in a web application background without interfering by changing the current web page.
What is the flag shown on the contact-msg network request?
1
THM{Got_AJAX_FLAG}

