THM: Into to Log Analysis

Ref:
Task 1 - Introduction
Log analysis is an essential aspect of cyber security and system monitoring. At a high level, log analysis examines and interprets log event data generated by various sources (devices, applications, and systems) to monitor metrics and identify security incidents. It involves collecting, parsing, and processing log files to turn data into actionable objectives. By adopting an effective log analysis strategy, security teams can more accurately respond to security incidents and gain proactive insights into potential threats.
In this room, we will explore concepts related to log analysis methodology, effective logging practices, and common tools to aid detection and response.
Learning Objectives
- Learn log analysis best practices.
- Discover the essential tools for log analysis.
- Gain hands-on experience in analyzing logs by using multiple tools and technologies.
Room Prerequisites
It is recommended to have a general understanding of logs and how they are collected. The preceding rooms in the Log Analysis module are great primers to this topic:
Task 2 - Log Analysis Basics
Among the various data sources collected and utilized by infrastructure systems, logs are pivotal in offering valuable insights into these systems’ inner workings and interactions across the network. A log is a stream of time-sequenced messages that record occurring events. Log analysis is the process of making sense of the events captured in the logs to paint a clear picture of what has happened across the infrastructure.
What Are Logs?
Logs are recorded events or transactions within a system, device, or application. Specifically, these events can be related to application errors, system faults, audited user actions, resource uses, network connections, and more. Each log entry contains relevant details to contextualize the event, such as its timestamp (the date and time it occurred), the source (the system that generated the log), and additional information about the specific log event.
sample.log
1
Jul 28 17:45:02 10.10.0.4 FW-1: %WARNING% general: Unusual network activity detected from IP 10.10.0.15 to IP 203.0.113.25. Source Zone: Internal, Destination Zone: External, Application: web-browsing, Action: Alert.
In the above example, this log entry signifies an event detected by a firewall regarding unusual network activity from an internal system, indicating a potential security concern. The relevant fields to consider in this example are:
Jul 28 17:45:02 - This timestamp shows the event’s date and time.
10.10.0.4 - This refers to the system’s IP address (the source) that generated the log.
%WARNING% - This indicates the severity of the log, in this case, Warning. Log entries are often given a severity level to categorize and communicate their relative importance or impact. These severity levels help prioritize responses, investigations, and actions based on the criticality of the events. Different systems might use slightly different severity levels, but commonly, you can expect to find the following increasing severity levels: Informational, Warning, Error, and Critical.
Action: Alert - In this case, the firewall’s policy was configured to notify when such unusual activity occurs.
The remaining fields give us specific information related to the logged event. Specifically, that unusual network activity was detected from IP 10.10.0.15 to IP 203.0.113.25. Based on the Source Zone field, the traffic appears destined for the Internet (External), and the Application was categorized as web-browsing.
Why Are Logs Important?
There are several reasons why collecting logs and adopting an effective log analysis strategy is vital for an organization’s ongoing operations. Some of the most common activities include:
System Troubleshooting: Analyzing system errors and warning logs helps IT teams understand and quickly respond to system failures, minimizing downtime, and improving overall system reliability.
Cyber Security Incidents: In the security context, logs are crucial in detecting and responding to security incidents. Firewall logs, intrusion detection system (IDS) logs, and system authentication logs, for example, contain vital information about potential threats and suspicious activities. Performing log analysis helps SOC teams and Security Analysts identify and quickly respond to unauthorized access attempts, malware, data breaches, and other malicious activities.
Threat Hunting: On the proactive side, cyber security teams can use collected logs to actively search for advanced threats that may have evaded traditional security measures. Security Analysts and Threat Hunters can analyze logs to look for unusual patterns, anomalies, and indicators of compromise (IOCs) that might indicate the presence of a threat actor.
Compliance: Organizations must often maintain detailed records of their system’s activities for regulatory and compliance purposes. Regular log analysis ensures that organizations can provide accurate reports and demonstrate compliance with regulations such as GDPR, HIPAA, or PCI DSS.
Types of Logs
As discussed in the Intro to Logs room, different components within a computing environment generate various types of logs, each serving a distinct purpose. These log types include, but are not limited to:
Application Logs: Messages from specific applications, providing insights into their status, errors, warnings, and other operational details.
Audit Logs: Events, actions, and changes occurring within a system or application, providing a history of user activities and system behavior.
Security Logs: Security-related events like logins, permission alterations, firewall activities, and other actions impacting system security.
Server Logs: System logs, event logs, error logs, and access logs, each offering distinct information about server operations. System Logs: Kernel activities, system errors, boot sequences, and hardware status, aiding in diagnosing system issues.
Network Logs: Communication and activity within a network, capturing information about events, connections, and data transfers. Database Logs: Activities within a database system, such as queries performed, actions, and updates.
Web Server Logs: Requests processed by web servers, including URLs, source IP addresses, request types, response codes, and more. Each log type presents a unique perspective on the activities within an environment, and analyzing these logs in context to one another is crucial for effective cyber security investigation and threat detection.
Each log type presents a unique perspective on the activities within an environment, and analyzing these logs in context to one another is crucial for effective cyber security investigation and threat detection.
Task 3 - Investigation Theory
Several methodologies, best practices, and essential techniques are employed to create a coherent timeline and conduct effective log analysis investigations.
Timeline
When conducting log analysis, creating a timeline is a fundamental aspect of understanding the sequence of events within systems, devices, and applications. At a high level, a timeline is a chronological representation of the logged events, ordered based on their occurrence. The ability to visualize a timeline is a powerful tool for contextualizing and comprehending the events that occurred over a specific period.
Within incident response scenarios, timelines play a crucial role in reconstructing security incidents. With an effective timeline, security analysts can trace the sequence of events leading up to an incident, allowing them to identify the initial point of compromise and understand the attacker’s tactics, techniques and procedures (TTPs).
Timestamp
In most cases, logs will typically include timestamps that record when an event occurred. With the potential of many distributed devices, applications, and systems generating individual log events across various regions, it’s crucial to consider each log’s time zone and format. Converting timestamps to a consistent time zone is necessary for accurate log analysis and correlation across different log sources.
Many log monitoring solutions solve this issue through timezone detection and automatic configuration. Splunk, for example, automatically detects and processes time zones when data is indexed and searched. Regardless of how time is specified in individual log events, timestamps are converted to UNIX time and stored in the _time field when indexed.
This consistent timestamp can then be converted to a local timezone during visualization, which makes reporting and analysis more efficient. This strategy ensures that analysts can conduct accurate investigations and gain valuable insights from their log data without manual intervention.
Super Timelines
A super timeline, also known as a consolidated timeline, is a powerful concept in log analysis and digital forensics. Super timelines provide a comprehensive view of events across different systems, devices, and applications, allowing analysts to understand the sequence of events holistically. This is particularly useful for investigating security incidents involving multiple components or systems.
Super timelines often include data from previously discussed log sources, such as system logs, application logs, network traffic logs, firewall logs, and more. By combining these disparate sources into a single timeline, analysts can identify correlations and patterns that need to be apparent when analyzing logs individually.
Creating a consolidated timeline with all this information manually would take time and effort. Not only would you have to record timestamps for every file on the system, but you would also need to understand the data storage methods of every application. Fortunately, Plaso (Python Log2Timeline) is an open-source tool created by Kristinn Gudjonsson and many contributors that automates the creation of timelines from various log sources. It’s specifically designed for digital forensics and log analysis and can parse and process log data from a wide range of sources to create a unified, chronological timeline.
To learn more about Plaso and its capabilities, visit the official documentation page here.
Data Visualization
Data visualization tools, such as Kibana (of the Elastic Stack) and Splunk, help to convert raw log data into interactive and insightful visual representations through a user interface. Tools like these enable security analysts to understand the indexed data by visualizing patterns and anomalies, often in a graphical view. Multiple visualizations, metrics, and graphic elements can be constructed into a tailored dashboard view, allowing for a comprehensive “single pane of glass” view for log analysis operations.
To create effective log visualizations, it’s essential first to understand the data (and sources) being collected and define clear objectives for visualization.
For example, suppose the objective is to monitor and detect patterns of increased failed login attempts. In that case, we should look to visualize logs that audit login attempts from an authentication server or user device. A good solution would be to create a line chart that displays the trend of failed login attempts over time. To manage the density of captured data, we can filter the visualization to show the past seven days. That would give us a good starting point to visualize increased failed attempts and spot anomalies.
Log Monitoring and Alerting
In addition to visualization, implementing effective log monitoring and alerting allows security teams to proactively identify threats and immediately respond when an alert is generated.
Many SIEM solutions (like Splunk and the Elastic Stack) allow the creation of custom alerts based on metrics obtained in log events. Events worth creating alerts for may include multiple failed login attempts, privilege escalation, access to sensitive files, or other indicators of potential security breaches. Alerts ensure that security teams are promptly notified of suspicious activities that require immediate attention.
Roles and responsibilities should be defined for escalation and notification procedures during various stages of the incident response process. Escalation procedures ensure that incidents are addressed promptly and that the right personnel are informed at each severity level.
For a hands-on walkthrough on dashboards and alerting within Splunk, it is recommended to check out the Splunk: Dashboards and Reports room!
External Research and Threat Intel
Identifying what may be of interest to us in log analysis is essential. It is challenging to analyze a log if we’re not entirely sure what we are looking for.
First, let’s understand what threat intelligence is. In summary, threat intelligence are pieces of information that can be attributed to a malicious actor. Examples of threat intelligence include:
- IP Addresses
- File Hashes
- Domains
When analyzing a log file, we can search for the presence of threat intelligence. For example, take this Apache2 web server entry below. We can see that an IP address has tried to access our site’s admin panel.
Outputting an Apache2 Access Log
1
cmnatic@thm cat access.log
1
2
3
4
54.36.149.64 - - [25/Aug/2023:00:05:36 +0000] "GET /admin HTTP/1.1" 200 8260 "-" "Mozilla/5.0 (compatible; AhrefsBot/7.0; +http://ahrefs.com/robot/)"
191.96.106.80 - - [25/Aug/2023:00:33:11 +0000] "GET /TryHackMe/rooms/docker-rodeo/dockerregistry/catalog1.png HTTP/1.1" 200 19594 "https://tryhackme.com/" "Mozi>
54.36.148.244 - - [25/Aug/2023:00:34:46 +0000] "GET /TryHackMe/?C=D;O=D HTTP/1.1" 200 5879 "-" "Mozilla/5.0 (compatible; AhrefsBot/7.0; +http://ahrefs.com/robot>
66.249.66.68 - - [25/Aug/2023:00:35:53 +0000] "GET /TryHackMe%20Designs/ HTTP/1.1" 200 5973 "-" "Mozilla/5.0 (Linux; Android 6.0.1; Nexus 5X Build/MMB29P) 200 19594 "https://tryhackme.com/" "Mozi>
Using a threat intelligence feed like ThreatFox, we can search our log files for known malicious actors’ presence.
Using GREP to search a logfile for an IP address
1
2
cmnatic@thm grep "54.36.149.64" logfile.txt
54.36.149.64
What’s the term for a consolidated chronological view of logged events from diverse sources, often used in log analysis and digital forensics? Answer : Super Timelines
Which threat intelligence indicator would 5b31f93c09ad1d065c0491b764d04933 and 763f8bdbc98d105a8e82f36157e98bbe be classified as?
Answer : File Hashes
Task 4 - Detection Engineering
Common Log File Locations
A crucial aspect of log analysis is understanding where to locate log files generated by various applications and systems. While log file paths can vary due to system configurations, software versions, and custom settings, knowing common log file locations is essential for efficient investigation and threat detection.
- Web Servers:
- Nginx:
- Access Logs: /var/log/nginx/access.log
- Error Logs: /var/log/nginx/error.log
- Nginx:
- Apache:
- Access Logs: /var/log/apache2/access.log
- Error Logs: /var/log/apache2/error.log
- Databases:
- MySQL:
- Error Logs: /var/log/mysql/error.log
- PostgreSQL:
- Error and Activity Logs: /var/log/postgresql/postgresql-{version}-main.log
- MySQL:
- Web Applications:
- PHP:
- Error Logs: /var/log/php/error.log
- PHP:
- Operating Systems:
- Linux:
- General System Logs: /var/log/syslog
- Authentication Logs: /var/log/auth.log
- Linux:
- Firewalls and IDS/IPS:
- iptables:
- Firewall Logs: /var/log/iptables.log
- iptables:
- Snort:
- Snort Logs: /var/log/snort/
While these are common log file paths, it’s important to note that actual paths may differ based on system configurations, software versions, and custom settings. It’s recommended to consult the official documentation or configuration files to verify the correct log file paths to ensure accurate analysis and investigation.
Common Patterns
In a security context, recognizing common patterns and trends in log data is crucial for identifying potential security threats. These “patterns” refer to the identifiable artifacts left behind in logs by threat actors or cyber security incidents. Fortunately, there are some common patterns that, if learned, will improve your detection abilities and allow you to respond efficiently to incidents.
Abnormal User Behavior
One of the primary patterns that can be identified is related to unusual or anomalous user behavior. This refers to any actions or activities conducted by users that deviate from their typical or expected behavior.
To effectively detect anomalous user behavior, organizations can employ log analysis solutions that incorporate detection engines and machine learning algorithms to establish normal behavior patterns. Deviations from these patterns or baselines can then be alerted as potential security incidents. Some examples of these solutions include Splunk User Behavior Analytics (UBA), IBM QRadar UBA, and Azure AD Identity Protection.
The specific indicators can vary greatly depending on the source, but some examples of this that can be found in log files include:
- Multiple failed login attempts
- Unusually high numbers of failed logins within a short time may indicate a brute-force attack.
- Unusual login times
- Login events outside the user’s typical access hours or patterns might signal unauthorized access or compromised accounts.
- Geographic anomalies
- Login events from IP addresses in countries the user does not usually access can indicate potential account compromise or suspicious activity.
- In addition, simultaneous logins from different geographic locations (or indications of impossible travel) may suggest account sharing or unauthorized access.
- Frequent password changes
- Log events indicating that a user’s password has been changed frequently in a short period may suggest an attempt to hide unauthorized access or take over an account.
- Unusual user-agent strings
- In the context of HTTP traffic logs, requests from users with uncommon user-agent strings that deviate from their typical browser may indicate automated attacks or malicious activities.
- For example, by default, the Nmap scanner will log a user agent containing “Nmap Scripting Engine.” The Hydra brute-forcing tool, by default, will include “(Hydra)” in its user-agent. These indicators can be useful in log files to detect potential malicious activity.
The significance of these anomalies can vary greatly depending on the specific context and the systems in place, so it is essential to fine-tune any automated anomaly detection mechanisms to minimize false positives.
Common Attack Signatures
Identifying common attack signatures in log data is an effective way to detect and quickly respond to threats. Attack signatures contain specific patterns or characteristics left behind by threat actors. They can include malware infections, web-based attacks (SQL injection, cross-site scripting, directory traversal), and more. As this is entirely dependent on the attack surface, some high-level examples include:
SQL Injection
SQL injection attempts to exploit vulnerabilities in web applications that interact with databases. Look for unusual or malformed SQL queries in the application or database logs to identify common SQL injection attack patterns.
Suspicious SQL queries might contain unexpected characters, such as single quotes ('), comments (--, #), union statements (UNION), or time-based attacks (WAITFOR DELAY, SLEEP()). A useful SQLi payload list to reference can be found here.
In the below example, an SQL injection attempt can be identified by the ‘ UNION SELECT section of the q= query parameter. The attacker appears to have escaped the SQL query with the single quote and injected a union select statement to retrieve information from the users table in the database. Often, this payload may be URL-encoded, requiring an additional processing step to identify it efficiently.
sqli.log
1
10.10.61.21 - - [2023-08-02 15:27:42] "GET /products.php?q=books' UNION SELECT null, null, username, password, null FROM users-- HTTP/1.1" 200 3122
Cross-Site Scripting (XSS)
Exploiting cross-site scripting (XSS) vulnerabilities allow attackers to inject malicious scripts into web pages. To identify common XSS attack patterns, it is often helpful to look for log entries with unexpected or unusual input that includes script tags (<script>) and event handlers (onmouseover, onclick, onerror). A useful XSS payload list to reference can be found here.
In the example below, a cross-site scripting attempt can be identified by the <script>alert(1);</script> payload inserted into the search parameter, which is a common testing method for XSS vulnerabilities.
xss.log
1
10.10.19.31 - - [2023-08-04 16:12:11] "GET /products.php?search=<script>alert(1);</script> HTTP/1.1" 200 5153
Path Traversal
Exploiting path traversal vulnerabilities allows attackers to access files and directories outside a web application’s intended directory structure, leading to unauthorized access to sensitive files or code. To identify common traversal attack patterns, look for traversal sequence characters (../ and ../../) and indications of access to sensitive files (/etc/passwd, /etc/shadow). A useful directory traversal payload list to reference can be found here.
It is important to note, like with the above examples, that directory traversals are often URL encoded (or double URL encoded) to avoid detection by firewalls or monitoring tools. Because of this, %2E and %2F are useful URL-encoded characters to know as they refer to the . and /` respectively.
In the below example, a directory traversal attempt can be identified by the repeated sequence of ../ characters, indicating that the attacker is attempting to “back out” of the web directory and access the sensitive /etc/passwd file on the server.
path-traversal.log
1
10.10.113.45 - - [2023-08-05 18:17:25] "GET /../../../../../etc/passwd HTTP/1.1" 200 505
What is the default file path to view logs regarding HTTP requests on an Nginx server?
Answer : /var/log/nginx/access.log
A log entry containing %2E%2E%2F%2E%2E%2Fproc%2Fself%2Fenviron was identified. What kind of attack might this infer?
Answer : Path Traversal
Task 5 - Automated vs. Manual Analysis
Automated Analysis
Automated analysis involves the use of tools. For example, these often include commercial tools such as XPLG or SolarWinds Loggly. Automated analysis tools allow for processing and data analysis of logs. These tools often utilize Artificial Intelligence / Machine Learning to analyze patterns and trends. As the AI landscape evolves, we expect to see more effective automated analysis solutions.
Advantages
Saves time by performing a lot of the manual work required in manual analysis
The use of artificial intelligence is effective at recognizing patterns and trends.
Disadvantages
Automated analysis tools are usually commercial-only and, therefore, expensive.
The effectiveness of artificial intelligence depends on how capable the model is. For example, the risk of false positives increases, or newer or never-seen-before events can be missed as the AI is not trained to recognize these.
Manual Analysis
Manual analysis is the process of examining data and artifacts without using automation tools. For example, an analyst scrolling through a web server log would be considered manual analysis. Manual analysis is essential for an analyst because automation tools cannot be relied upon.
Advantages
It is cheap and does not require expensive tooling. For example, simple Linux commands can do the trick.
Allows for a thorough investigation.
Reduces the risk of overfitting or false positives on alerts from automated tools.
Allows for contextual analysis. The analyst has a broader understanding of the organization and cyber security landscape.
Disadvantages
It is time-consuming as the analyst has to do all of the work, including reformatting log files.
N/A
Events or alerts can be missed! Especially if there is a lot of data to comb through.
N/A
A log file is processed by a tool which returns an output. What form of analysis is this?
Answer : Automated
An analyst opens a log file and searches for events. What form of analysis is this?
Answer : Manual
Task 6 - Log Analysis Tools: Command Line
When analyzing collected logs, sometimes the most readily available tool we have is the command line itself. Analyzing logs through the command line provides a quick and powerful way to gain insights into system activities, troubleshoot issues, and detect security incidents, even if we don’t have an SIEM system configured.
Many built-in Linux commands allow us to parse and filter relevant information quickly. Viewing log files using the command line is one of the most basic yet essential tasks for conducting log analysis. Several common built-in tools are used for this purpose, offering differing functionalities to read and navigate through log files efficiently.
You can locate the apache.log file on the AttackBox under /root/Rooms/introloganalysis/task6 to follow along with this task. However, it is also attached to this task and available for download.
cat
The cat command (short for “concatenate”) is a simple utility that reads one or more files and displays its content in the terminal. When used for log files, it prints the entire log content to the screen.
For example, to view the contents of a log file named apache.log, you can use the command:
cat Example
1
user@tryhackme$ cat apache.log
1
2
3
4
5
6
203.0.113.42 - - [31/Jul/2023:12:34:56 +0000] "GET /index.php HTTP/1.1" 200 1234 "Mozilla/5.0 (Windows NT 10.0; Win64; x64) AppleWebKit/537.36 (KHTML, like Gecko) Chrome/80.0.3987.132 Safari/537.36"
120.54.86.23 - - [31/Jul/2023:12:34:57 +0000] "GET /contact.php HTTP/1.1" 404 5678 "Mozilla/5.0 (Windows NT 10.0; Win64; x64) AppleWebKit/537.36 (KHTML, like Gecko) Chrome/81.0.4044.138 Safari/537.36"
185.76.230.45 - - [31/Jul/2023:12:34:58 +0000] "GET /about.php HTTP/1.1" 200 9876 "Mozilla/5.0 (Windows NT 10.0; Win64; x64) AppleWebKit/537.36 (KHTML, like Gecko) Chrome/91.0.4472.164 Safari/537.36"
201.39.104.77 - - [31/Jul/2023:12:34:59 +0000] "GET /login.php HTTP/1.1" 200 4321 "Mozilla/5.0 (Windows NT 10.0; Win64; x64) AppleWebKit/537.36 (KHTML, like Gecko) Chrome/94.0.4606.54 Safari/537.36"
...
...
Due to its large output, it is typically not the best approach for dealing with long log files.
less
The less command is an improvement over cat when dealing with larger files. It allows you to view the file's data page by page, providing a more convenient way to read through lengthy logs. When using less to open a file, it displays the first page by default, and you can scroll down using the arrow keys or with Page Up and Page Down.
For example, to view the same log file using less, use the command:
less Example
1
2
3
4
5
6
7
8
9
10
11
12
13
14
15
user@tryhackme$ less apache.log
...
...
HTTP/1.1" 200 7890 "Mozilla/5.0 (Windows NT 10.0; Win64; x64) AppleWebKit/537.36 (KHTML, like Gecko) Chrome/94.0.4606.350 Safari/5>
P/1.1" 404 4321 "Mozilla/5.0 (Windows NT 10.0; Win64; x64) AppleWebKit/537.36 (KHTML, like Gecko) Chrome/94.0.4606.81 Safari/537.3>
TTP/1.1" 200 1234 "Mozilla/5.0 (Windows NT 10.0; Win64; x64) AppleWebKit/537.36 (KHTML, like Gecko) Chrome/94.0.4606.90 Safari/537>
P/1.1" 200 5678 "Mozilla/5.0 (Windows NT 10.0; Win64; x64) AppleWebKit/537.36 (KHTML, like Gecko) Chrome/94.0.4606.81 Safari/537.3>
TTP/1.1" 404 5678 "Mozilla/5.0 (Windows NT 10.0; Win64; x64) AppleWebKit/537.36 (KHTML, like Gecko) Chrome/94.0.4606.54 Safari/537>
P/1.1" 200 1234 "Mozilla/5.0 (Windows NT 10.0; Win64; x64) AppleWebKit/537.36 (KHTML, like Gecko) Chrome/94.0.4606.85 Safari/537.3>
TP/1.1" 200 5678 "Mozilla/5.0 (Windows NT 10.0; Win64; x64) AppleWebKit/537.36 (KHTML, like Gecko) Chrome/94.0.4606.90 Safari/537.>
~
~
~
~
(END)
You can exit the command’s output via the q key.
tail
The tail command is specifically designed for viewing the end of files and is very useful for seeing a summary of recently generated events in the case of log files.
The most common use of tail is coupled with the -f option, which allows you to "follow" the log file in real-time, as it continuously updates the terminal with new log entries as they are generated and written. This is extremely useful when monitoring logs for live events or real-time system behavior.
By default, tail will only display the last ten lines of the file. However, we can change this with the -n option and specify the number of lines we want to view.
For example, if we only wanted to print the last five lines of the apache.log file and “follow” the logs in real-time, we can use the command:
tail Example
1
user@tryhackme$ tail -f -n 5 apache.log
1
2
3
4
5
176.145.201.99 - - [31/Jul/2023:12:34:24 +0000] "GET /login.php HTTP/1.1" 200 1234 "Mozilla/5.0 (Windows NT 10.0; Win64; x64) AppleWebKit/537.36 (KHTML, like Gecko) Chrome/94.0.4606.90 Safari/537.36"
104.76.29.88 - - [31/Jul/2023:12:34:23 +0000] "GET /index.php HTTP/1.1" 200 5678 "Mozilla/5.0 (Windows NT 10.0; Win64; x64) AppleWebKit/537.36 (KHTML, like Gecko) Chrome/94.0.4606.81 Safari/537.36"
128.45.76.66 - - [31/Jul/2023:12:34:22 +0000] "GET /contact.php HTTP/1.1" 404 5678 "Mozilla/5.0 (Windows NT 10.0; Win64; x64) AppleWebKit/537.36 (KHTML, like Gecko) Chrome/94.0.4606.54 Safari/537.36"
76.89.54.221 - - [31/Jul/2023:12:34:21 +0000] "GET /about.php HTTP/1.1" 200 1234 "Mozilla/5.0 (Windows NT 10.0; Win64; x64) AppleWebKit/537.36 (KHTML, like Gecko) Chrome/94.0.4606.85 Safari/537.36"
145.76.33.201 - - [31/Jul/2023:12:34:20 +0000] "GET /login.php HTTP/1.1" 200 5678 "Mozilla/5.0 (Windows NT 10.0; Win64; x64) AppleWebKit/537.36 (KHTML, like Gecko) Chrome/94.0.4606.90 Safari/537.36"
Being able to sort, filter, and manipulate log files from the command line is a crucial aspect of performing effective log analysis. Analysts often need to extract specific information, filter out relevant data, aggregate results, and transform logs to uncover insights and identify anomalies.
Note: The opposite of the tail command is head, which allows you to view the first ten lines of a file by default and takes in the same arguments. Feel free to experiment with this as well!
wc
The wc (word count) command is a simple but powerful utility that can be quite useful for quick analysis and statistics gathering. The output of wc provides information about the number of lines, words, and characters in a log file. This can help security analysts understand the size and volume of log data they are dealing with before diving into a more detailed analysis.
wc Example
1
user@tryhackme$ wc apache.log
1
   70  1562 14305 apache.log
After running wc on apache.log, we can determine that the file contains
- 70 lines,
- 1562 individual words (separated by whitespace)
- 14305 individual characters.
cut
The cut command extracts specific columns (fields) from files based on specified delimiters. This is a handy command for working with log files that have structured or tab-separated data.
If we want to extract all of the IP addresses in the file, we can use the cut command to specify a delimiter of a space character and only select the first field returned.
cut Example
1
user@tryhackme$ cut -d ' ' -f 1 apache.log
1
2
3
4
5
6
7
8
9
10
11
12
13
14
15
203.0.113.42
120.54.86.23
185.76.230.45
201.39.104.77
112.76.89.56
211.87.186.35
156.98.34.12
202.176.73.99
122.65.187.55
77.188.103.244
189.76.230.44
153.47.106.221
200.89.134.22
...
...
The above command will return a list of every IP address in the log file. Expanding on this, we can change the field number to
- -f 7 to extract the URLs
- -f 9 to extract the HTTP status codes.
sort
Sometimes, it’s helpful to sort the returned entries chronologically or alphabetically. The sort command arranges the data in files in ascending or descending order based on specific criteria.
This can be crucial for identifying patterns, trends, or outliers in our log data. It is also common to combine the output of another command (cut, for example) and use it as the input of the sort command using the pipe | redirection character.
For example, to sort the list of returned IP addresses from the above cut command, we can run:
sort Example
1
user@tryhackme$ cut -d ' ' -f 1 apache.log | sort -n
1
2
3
4
5
6
7
8
9
10
11
12
13
14
15
16
76.89.54.221
76.89.54.221
76.89.54.221
76.89.54.221
76.89.54.221
76.89.54.221
77.188.103.244
99.76.122.65
104.76.29.88
104.76.29.88
104.76.29.88
104.76.29.88
104.76.29.88
104.76.29.88
...
...
In the above command, we piped the output from cut into the sort command and added the -n option to sort numerically. This changed the output to list the IP addresses in ascending order.
If we want to reverse the order, we can add the -r option:
- -n option - sort
numerically - -r option - sort
reverse the order
sort Example (Reversed)
1
user@tryhackme$ cut -d ' ' -f 1 apache.log | sort -n -r
1
2
3
4
5
6
7
8
9
10
11
12
13
14
15
221.90.64.76
211.87.186.35
203.78.122.88
203.64.78.90
203.64.78.90
203.64.78.90
203.64.78.90
203.64.78.90
203.64.78.90
203.0.113.42
202.176.73.99
201.39.104.77
200.89.134.22
...
...
uniq
The uniq command identifies and removes adjacent duplicate lines from sorted input. In the context of log analysis, this can be a useful tool for simplifying data lists (like collected IP addresses), especially when log entries may contain repeated or redundant information.
The uniq command is often combined with the sort command to sort the data before removing the duplicate entries.
For example, the output of the sort command we ran above contains a few duplicate IP addresses, which is easier to spot when the data is sorted numerically. To remove these repeatedly extracted IPs from the list, we can run:
uniq Example
1
user@tryhackme$ cut -d ' ' -f 1 apache.log | sort -n -r | uniq
1
2
3
4
5
6
7
8
9
10
11
221.90.64.76
211.87.186.35
203.78.122.88
203.64.78.90
203.0.113.42
202.176.73.99
201.39.104.77
200.89.134.22
192.168.45.99
...
...
We can also append the -c option to output unique lines and prepend the count of occurrences for each line. This can be very useful for quickly determining IP addresses with unusually high traffic.
uniq Example (with count)
1
user@tryhackme$ cut -d ' ' -f 1 apache.log | sort -n -r | uniq -c
1
2
3
4
5
6
7
8
9
10
11
      1 221.90.64.76
      1 211.87.186.35
      1 203.78.122.88
      6 203.64.78.90
      1 203.0.113.42
      1 202.176.73.99
      1 201.39.104.77
      1 200.89.134.22
      1 192.168.45.99
...
...
sed
Both sed and awk are powerful text-processing tools commonly used for log analysis. They are sometimes used interchangeably, but both commands have their use cases and can allow security analysts to manipulate, extract, and transform log data efficiently.
Using the substitute syntax, sed can replace specific patterns or strings into log entries. For example, to replace all occurrences of "31/Jul/2023" with "July 31, 2023" in the apache.log file, we can use:
sed Example
1
user@tryhackme$ sed 's/31\/Jul\/2023/July 31, 2023/g' apache.log
1
2
3
4
203.0.113.42 - - [July 31, 2023:12:34:56 +0000] "GET /index.php HTTP/1.1" 200 1234 "Mozilla/5.0 (Windows NT 10.0; Win64; x64) AppleWebKit/537.36 (KHTML, like Gecko) Chrome/80.0.3987.132 Safari/537.36"
120.54.86.23 - - [July 31, 2023:12:34:57 +0000] "GET /contact.php HTTP/1.1" 404 5678 "Mozilla/5.0 (Windows NT 10.0; Win64; x64) AppleWebKit/537.36 (KHTML, like Gecko) Chrome/81.0.4044.138 Safari/537.36"
...
...
Note that the backslash character \ is required to “escape” the forward slash in our pattern and tell sed to treat the forward slash as a literal character.
Also, note that the sed command does not change the apache.log file directly; instead, it only outputs the modified version of the file to the standard output in the command line. If you want to overwrite the file, you can add the -i option to edit the file in place or use a redirect operator > to save the output to the original or another file.
Caution: If you use the -i option with sed, you risk overwriting the original file and losing valuable data. Ensure to keep a backup copy!
awk
For the awk command, a common use case, is conditional actions based on specific field values. For example, to print log entries where the HTTP response code is greater than or equal to 400 (which would indicate HTTP error statuses), we can use the following command:
awk Example
1
user@tryhackme$ awk '$9 >= 400' apache.log
1
2
3
4
5
120.54.86.23 - - [31/Jul/2023:12:34:57 +0000] "GET /contact.php HTTP/1.1" 404 5678 "Mozilla/5.0 (Windows NT 10.0; Win64; x64) AppleWebKit/537.36 (KHTML, like Gecko) Chrome/81.0.4044.138 Safari/537.36"
156.98.34.12 - - [31/Jul/2023:12:35:02 +0000] "GET /about.php HTTP/1.1" 404 5678 "Mozilla/5.0 (Windows NT 10.0; Win64; x64) AppleWebKit/537.36 (KHTML, like Gecko) Chrome/94.0.4606.85 Safari/537.36"
189.76.230.44 - - [31/Jul/2023:12:35:06 +0000] "GET /about.php HTTP/1.1" 404 1234 "Mozilla/5.0 (Windows NT 10.0; Win64; x64) AppleWebKit/537.36 (KHTML, like Gecko) Chrome/94.0.4606.170 Safari/537.36"
...
...
In this case, we’re using the $9 field (which in this log example refers to the HTTP status codes), requiring it to be greater than or equal to 400.
This only scratches the surface of the power of these commands, and it is highly encouraged to read more about their options and use cases here.
grep
The grep command is a powerful text search tool widely used on UNIX systems and provides exceptional use cases in log analysis. It allows you to search for specific patterns or regular expressions within files or streams of text. Using grep can help analysts quickly identify relevant log entries that match specific criteria, particular resources or keywords, or patterns associated with security incidents.
The most basic usage of grep is to search for specific strings within log files. For example, if we are suspicious about any log entries that hit the /admin.php webpage on the server, we can grep for “admin” to return any relevant results:
grep Example
1
user@tryhackme$ grep "admin" apache.log
1
145.76.33.201 - - [31/Jul/2023:12:34:54 +0000] "GET /admin.php HTTP/1.1" 200 4321 "Mozilla/5.0 (Windows NT 10.0; Win64; x64) AppleWebKit/537.36 (KHTML, like Gecko) Chrome/94.0.4606.330 Safari/537.36"
Like the uniq -c command, we can append the
- -c option to
grepto count the entries matching the search criteria. - For example, because only a single line was returned in the above command, appending -c will return “1”.
grep Example (with count)
1
user@tryhackme$ grep -c "admin" apache.log
1
1
If we wanted to know which line number in the log file relates to the matched entries, we could add the -n option to help quickly locate specific occurrences:
grep Example (line number)
1
user@tryhackme$ grep -n "admin" apache.log
1
37:145.76.33.201 - - [31/Jul/2023:12:34:54 +0000] "GET /admin.php HTTP/1.1" 200 4321 "Mozilla/5.0 (Windows NT 10.0; Win64; x64) AppleWebKit/537.36 (KHTML, like Gecko) Chrome/94.0.4606.330 Safari/537.36"
In this case, the line number "37" is prepended to the log entry output.
Lastly, we can invert our command using the -v option only to select lines that do not contain the specified pattern or keyword(s). This can be useful for quickly filtering out unwanted or irrelevant lines from log files. For example, if we’re not interested in any log entries that hit the /index.php page, we can run the following command to filter it out:
grep Example (inverted)
1
user@tryhackme$ grep -v "/index.php" apache.log | grep "203.64.78.90"
1
2
3
4
5
203.64.78.90 - - [31/Jul/2023:12:35:01 +0000] "GET /about.php HTTP/1.1" 404 4321 "Mozilla/5.0 (Windows NT 10.0; Win64; x64) AppleWebKit/537.36 (KHTML, like Gecko) Chrome/94.0.4606.170 Safari/537.36"
203.64.78.90 - - [31/Jul/2023:12:34:53 +0000] "GET /about.php HTTP/1.1" 200 1234 "Mozilla/5.0 (Windows NT 10.0; Win64; x64) AppleWebKit/537.36 (KHTML, like Gecko) Chrome/94.0.4606.210 Safari/537.36"
203.64.78.90 - - [31/Jul/2023:12:34:46 +0000] "GET /contact.php HTTP/1.1" 200 4321 "Mozilla/5.0 (Windows NT 10.0; Win64; x64) AppleWebKit/537.36 (KHTML, like Gecko) Chrome/94.0.4606.100 Safari/537.36"
203.64.78.90 - - [31/Jul/2023:12:34:32 +0000] "GET /login.php HTTP/1.1" 404 5678 "Mozilla/5.0 (Windows NT 10.0; Win64; x64) AppleWebKit/537.36 (KHTML, like Gecko) Chrome/94.0.4606.330 Safari/537.36"
203.64.78.90 - - [31/Jul/2023:12:34:25 +0000] "GET /about.php HTTP/1.1" 404 4321 "Mozilla/5.0 (Windows NT 10.0; Win64; x64) AppleWebKit/537.36 (KHTML, like Gecko) Chrome/94.0.4606.81 Safari/537.36"
Notice that in the above command, we filtered out the index.php page and piped the output into another grep command that only pulled log entries that contained the IP address 203.64.78.90.
Like with awk and sed, grep is an extremely powerful tool that cannot be fully covered in a single task. It is highly encouraged to read more about it on the official GNU manual page here.
While command-line log analysis offers powerful capabilities, it might only suit some scenarios, especially when dealing with vast and complex log datasets. A dedicated log analysis solution, like the Elastic (ELK) Stack or Splunk, can be more efficient and offer additional log analysis and visualization features. However, the command line remains essential for quick and straightforward log analysis tasks.
- Use cut on the apache.log file to return only the URLs. What is the flag that is returned in one of the unique entries?
1
2
3
root@ip-10-10-64-111:~/Rooms/introloganalysis/task6# dir
    apache.log
root@ip-10-10-64-111:~/Rooms/introloganalysis/task6# cut -d ' ' -f 7    apache.log
1
2
3
4
5
6
7
8
9
10
11
...
...
/about.php
/login.php
/index.php
/contact.php
/about.php
/login.php
/index.php?flag=c701d43cc5a3acb9b5b04db7f1be94f6
...
...
1
Answer : c701d43cc5a3acb9b5b04db7f1be94f6
- In the apache.log file, how many total HTTP 200 responses were logged?
Hint: With the “awk” command, “==” is used for equality comparisons.
1
2
3
root@ip-10-10-64-111:~/Rooms/introloganalysis/task6# awk '$9 == 200' apache.log | wc
     52    1144   10485
root@ip-10-10-64-111:~/Rooms/introloganalysis/task6#
1
Answer : 52
- In the apache.log file, which IP address generated the most traffic?
Hint: Useful commands to help answer this question include “cut”, “sort”, and “uniq”.
1
2
root@ip-10-10-64-111:~/Rooms/introloganalysis/task6#
cut -d ' ' -f 1 apache.log | sort -n | uniq -c
1
2
3
4
5
6
7
8
9
10
11
12
13
14
15
16
17
18
19
20
21
22
23
24
25
26
27
28
29
30
31
32
33
      6 76.89.54.221
      1 77.188.103.244
      1 99.76.122.65
      6 104.76.29.88
      1 108.76.122.35
      1 109.34.78.90
      6 110.122.65.76
      1 110.76.122.65
      1 112.76.89.56
      1 120.54.86.23
      1 122.65.187.55
      6 128.45.76.66
      1 141.89.23.76
      8 145.76.33.201
      1 153.47.106.221
      1 156.98.34.12
      6 176.145.201.99
      1 177.34.78.90
      2 178.53.64.100
      1 185.76.230.45
      1 188.145.201.99
      1 188.96.105.221
      1 188.99.145.201
      1 189.76.230.44
      1 192.168.45.99
      1 200.89.134.22
      1 201.39.104.77
      1 202.176.73.99
      1 203.0.113.42
      6 203.64.78.90
      1 203.78.122.88
      1 211.87.186.35
      1 221.90.64.76
1
Answer : 145.76.33.201
- What is the complete timestamp of the entry where 110.122.65.76 accessed /login.php?
1
2
root@ip-10-10-64-111:~/Rooms/introloganalysis/task6#
grep -v "/login.php?" apache.log | grep "110.122.65.76"
1
2
3
4
5
6
7
110.122.65.76 - - [31/Jul/2023:12:35:02 +0000] "GET /contact.php HTTP/1.1" 200 1234 "Mozilla/5.0 (Windows NT 10.0; Win64; x64) AppleWebKit/537.36 (KHTML, like Gecko) Chrome/94.0.4606.210 Safari/537.36"
110.122.65.76 - - [31/Jul/2023:12:34:54 +0000] "GET /contact.php HTTP/1.1" 200 7890 "Mozilla/5.0 (Windows NT 10.0; Win64; x64) AppleWebKit/537.36 (KHTML, like Gecko) Chrome/94.0.4606.330 Safari/537.36"
110.122.65.76 - - [31/Jul/2023:12:34:47 +0000] "GET /index.php HTTP/1.1" 200 9876 "Mozilla/5.0 (Windows NT 10.0; Win64; x64) AppleWebKit/537.36 (KHTML, like Gecko) Chrome/94.0.4606.230 Safari/537.36"
110.122.65.76 - - [31/Jul/2023:12:34:40 +0000] "GET /login.php HTTP/1.1" 200 9876 "Mozilla/5.0 (Windows NT 10.0; Win64; x64) AppleWebKit/537.36 (KHTML, like Gecko) Chrome/95.0.4638.110 Safari/537.36"
110.122.65.76 - - [31/Jul/2023:12:34:33 +0000] "GET /about.php HTTP/1.1" 200 9876 "Mozilla/5.0 (Windows NT 10.0; Win64; x64) AppleWebKit/537.36 (KHTML, like Gecko) Chrome/94.0.4606.100 Safari/537.36"
110.122.65.76 - - [31/Jul/2023:12:34:26 +0000] "GET /contact.php HTTP/1.1" 200 7890 "Mozilla/5.0 (Windows NT 10.0; Win64; x64) AppleWebKit/537.36 (KHTML, like Gecko) Chrome/94.0.4606.350 Safari/537.36"
1
Answer : 31/Jul/2023:12:34:40 +0000
Task 7 - Log Analysis Tools: Regular Expressions
Regular expressions, abbreviated as regex, are an invaluable way to define patterns for searching, matching, and manipulating text data. Regular expression patterns are constructed using a combination of special characters that represent matching rules and are supported in many programming languages, text editors, and software.
This room won’t cover the in-depth use of constructing regular expression patterns. However, the Regular expressions room is a fantastic resource for learning and practicing regex.
Regular expressions are widely used in log analysis to extract relevant information, filter data, identify patterns, and process logs before they are forwarded to a centralized SIEM system. It’s even possible to use regex with the grep command, as it is an extremely powerful way to search for patterns in log files.
Regular Expressions for grep
As a simple example, refer to the apache-ex2.log file within the ZIP file attached to this task. You can locate the task files on the AttackBox under /root/Rooms/introloganalysis/task7. Ensure to unzip the file first by running unzip regex.zip and then cd regex.
This log file contains log entries from a blog site. The site is structured so that each blog post has its unique ID, fetched from the database dynamically through the post URL parameter.
If we are only interested in the specific blog posts with an ID between 10-19, we can run the following grep regular expression pattern on the log file:
grep Regex Example
1
2
3
user@tryhackme$

grep -E 'post=1[0-9]' apache-ex2.log
1
2
3
4
5
6
7
8
9
203.0.113.1 - - [02/Aug/2023:10:15:23 +0000] "GET /blog.php?post=12 HTTP/1.1" 200 - "Mozilla/5.0"
100.22.189.54 - - [03/Aug/2023:12:48:43 +0000] "GET /blog.php?post=14 HTTP/1.1" 200 - "Mozilla/5.0"
34.210.98.12 - - [03/Aug/2023:15:30:56 +0000] "GET /blog.php?post=11 HTTP/1.1" 200 - "Mozilla/5.0"
102.210.76.44 - - [04/Aug/2023:19:26:29 +0000] "GET /blog.php?post=16 HTTP/1.1" 200 - "Mozilla/5.0"
98.88.76.103 - - [05/Aug/2023:17:56:33 +0000] "GET /blog.php?post=13 HTTP/1.1" 200 - "Mozilla/5.0"
76.88.44.90 - - [06/Aug/2023:12:58:22 +0000] "GET /blog.php?post=17 HTTP/1.1" 200 - "Mozilla/5.0"
98.76.102.33 - - [07/Aug/2023:15:24:30 +0000] "GET /blog.php?post=19 HTTP/1.1" 200 - "Mozilla/5.0"
...
...
Notice that we added the
-E option to signify that we are searching on a pattern rather than just a string, which is what allows us to use regex. For the pattern itself, we match the literal characters post=.
After which, we include the number 1 followed by the dynamic insertion of characters 0-9 using [0-9].
Putting this together,
1[0-9]will match any two-digit number that starts with “1”, such as 10, 11, 12, and onward.
Regular Expressions for Log Parsing
Regular expressions also play a crucial role in log parsing, which is the process of breaking down log entries into structured components and extracting relevant information from them. Log files from different sources can have diverse formats and fields, sometimes requiring additional processing to transform raw log data into structured, actionable information.
Additionally, engineers can create custom regex patterns tailored to specific logs to map specific parts of a log entry to named fields for an SIEM system. Overall, this process makes it much easier to query and analyze the extracted data later.
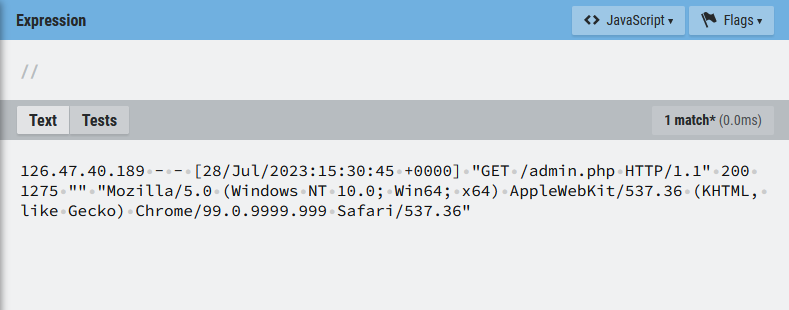
Consider the following raw, unstructured log entry:
Log Entry Example
1
126.47.40.189 - - [28/Jul/2023:15:30:45 +0000] "GET /admin.php HTTP/1.1" 200 1275 "" "Mozilla/5.0 (Windows NT 10.0; Win64; x64) AppleWebKit/537.36 (KHTML, like Gecko) Chrome/99.0.9999.999 Safari/537.36"
From a security standpoint, several fields here would be beneficial to extract into an SIEM for visualization. Some of these include:
- The IP address
- The timestamp
- The HTTP method (POST, GET, or PUT, for example)
- The URL
- The user-agent
RegExr is an online tool to help teach, build, and test regular expression patterns. To follow along, copy the above log entry and paste it into the “Text” section of the tool.
As a basic example, if we want to extract just the remote IP address from this log, we can think about the structure of the IP address logically. The IP address is the log entry’s first part, consisting of four octets separated by periods. We can use the following pattern:
1
\b([0-9]{1,3}\.){3}[0-9]{1,3}\b
Paste this pattern into the “Expression” field in RegExr, and you will notice that the IP address from the log is successfully extracted and highlighted.
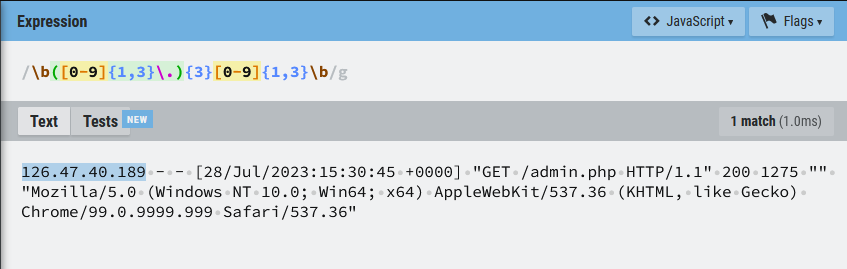
Breaking this pattern down, it begins and ends with a word boundary anchor \b to ensure we match complete IP addresses. In between, we define the following:
[0-9]{1,3} - Matches one to three digits to match numbers from 0 to 999. While IPv4 addresses octets cannot exceed 255, this simplified pattern works for our use case.
. - Escapes and matches a literal . character in the IP address.
{3} - Specifies that the previous capturing group ([0-9]{1,3}.) should be repeated three times.
[0-9]{1,3} - Again, this matches numbers from 0 to 999, completing the fourth octet of the IP address.
Example: Logstash and Grok
Grok is a powerful Logstash plugin that enables you to parse unstructured log data into something structured and searchable. It’s commonly used for any log format written for humans to read rather than for computer consumption. It works by combining text patterns with the %{SYNTAX:SEMANTIC} pattern syntax. However, sometimes, Logstash lacks the built-in pattern we need. In these cases, we can define custom patterns using the Oniguruma syntax and take advantage of regular expressions. More info on Grok and its use within the Elastic Stack can be found in the Elastic documentation here.
We can use the pattern we previously created to successfully extract IPv4 addresses from our log file and process them into a custom field before they are sent to an SIEM. In an Elastic Stack scenario, we can add a filter using the Grok plugin within our Logstash configuration file to achieve this.
logstash.conf
1
2
3
4
5
6
7
8
9
10
11
12
13
input {
  ...
}

filter {
  grok {
    match => { "message" => "(?<ipv4_address>\b([0-9]{1,3}\.){3}[0-9]{1,3}\b)" }
  }
}

output {
  ...
}
In the configuration above, we use our previously defined regular expression pattern to extract IPv4 addresses from the “message” field of incoming log events. The extracted values will be added under the custom “ipv4_addresses” field name we defined. Typically, IP addresses are extracted automatically by default configurations. But this simple example shows the power of regular expression patterns when dealing with complex log files and custom field requirements.
The Logstash room and the official Grok documentation are fantastic resources for further exploring Logstash input and filter configurations!
- How would you modify the original grep pattern above to match blog posts with an ID between 22-26? Answer : POST=2[2-6]
1
 grep -E 'POST=2[2-6]' apache-ex2.log
What is the name of the filter plugin used in Logstash to parse unstructured log data?
Answer : Grok
Task 8 - Log Analysis Tools: CyberChef
CyberChef is a powerful tool in an analyst’s toolkit. Created by GCHQ, CyberChef has long been regarded as the “Cyber Swiss Army Knife.” The application boasts over 300 operations, which combine to make a recipe that makes handling data a piece of cake. Some key features include:
- Encoding and decoding data
- Encryption and hashing algorithms
- Data analysis, such as parsing log files and extracting data
- And many more!
This task is going to demonstrate how CyberChef can be used to parse a log file alongside the use of recipes for analysis. Before we begin, let’s become familiar with the CyberChef interface. First, let’s launch CyberChef in our browser by visiting CyberChef. Note, if you are a free user on the AttackBox, a local copy of CyberChef is installed and can be accessed by clicking the “Offline CyberChef” bookmark in Firefox.
Understanding CyberChef
Let’s break down the interface:
- The “Operations” tab - This tab allows us to select what we wish to do with the input
- Recipe - This tab is a collection of operations
- Input - This tab is where we input the data or source that we want to analyze
- Output - This tab is the final output of the input after the operations have been applied
Let’s demonstrate CyberChef in use. In this example, I provide an input "dHJ5aGFja21l", which is "tryhackme" in base64. After selecting the “From Base64” operation, we can see the output of “tryhackme”:
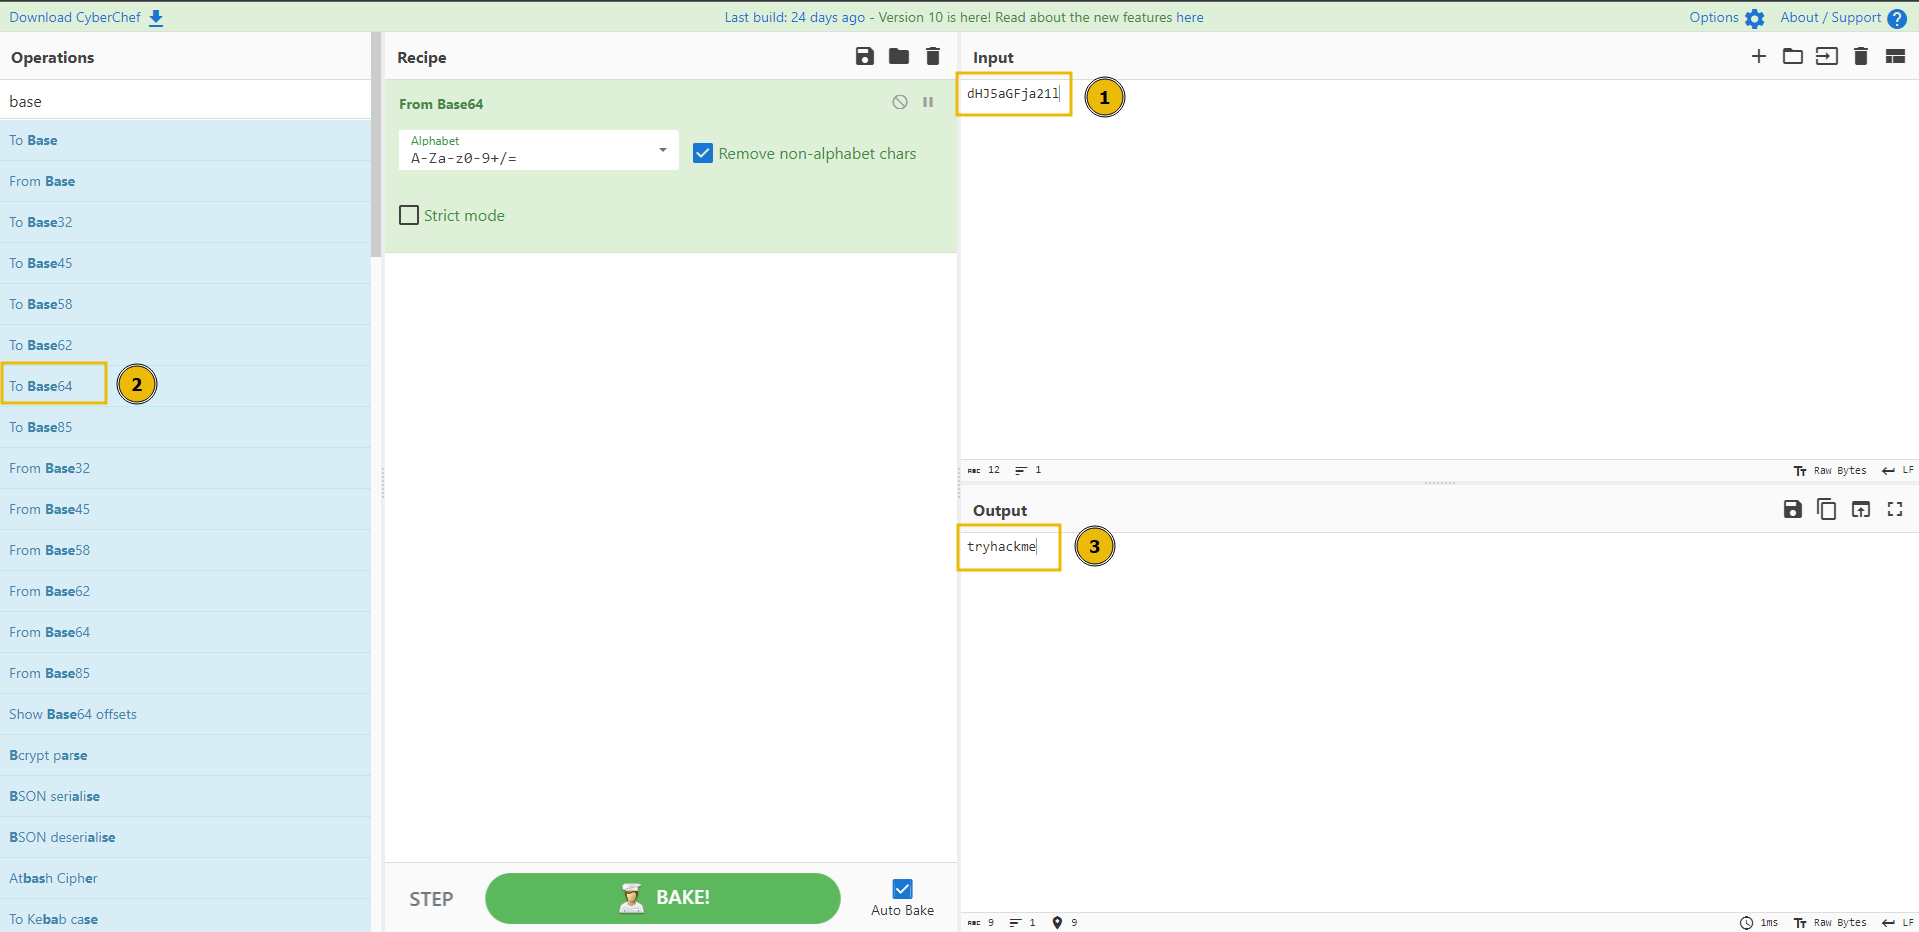
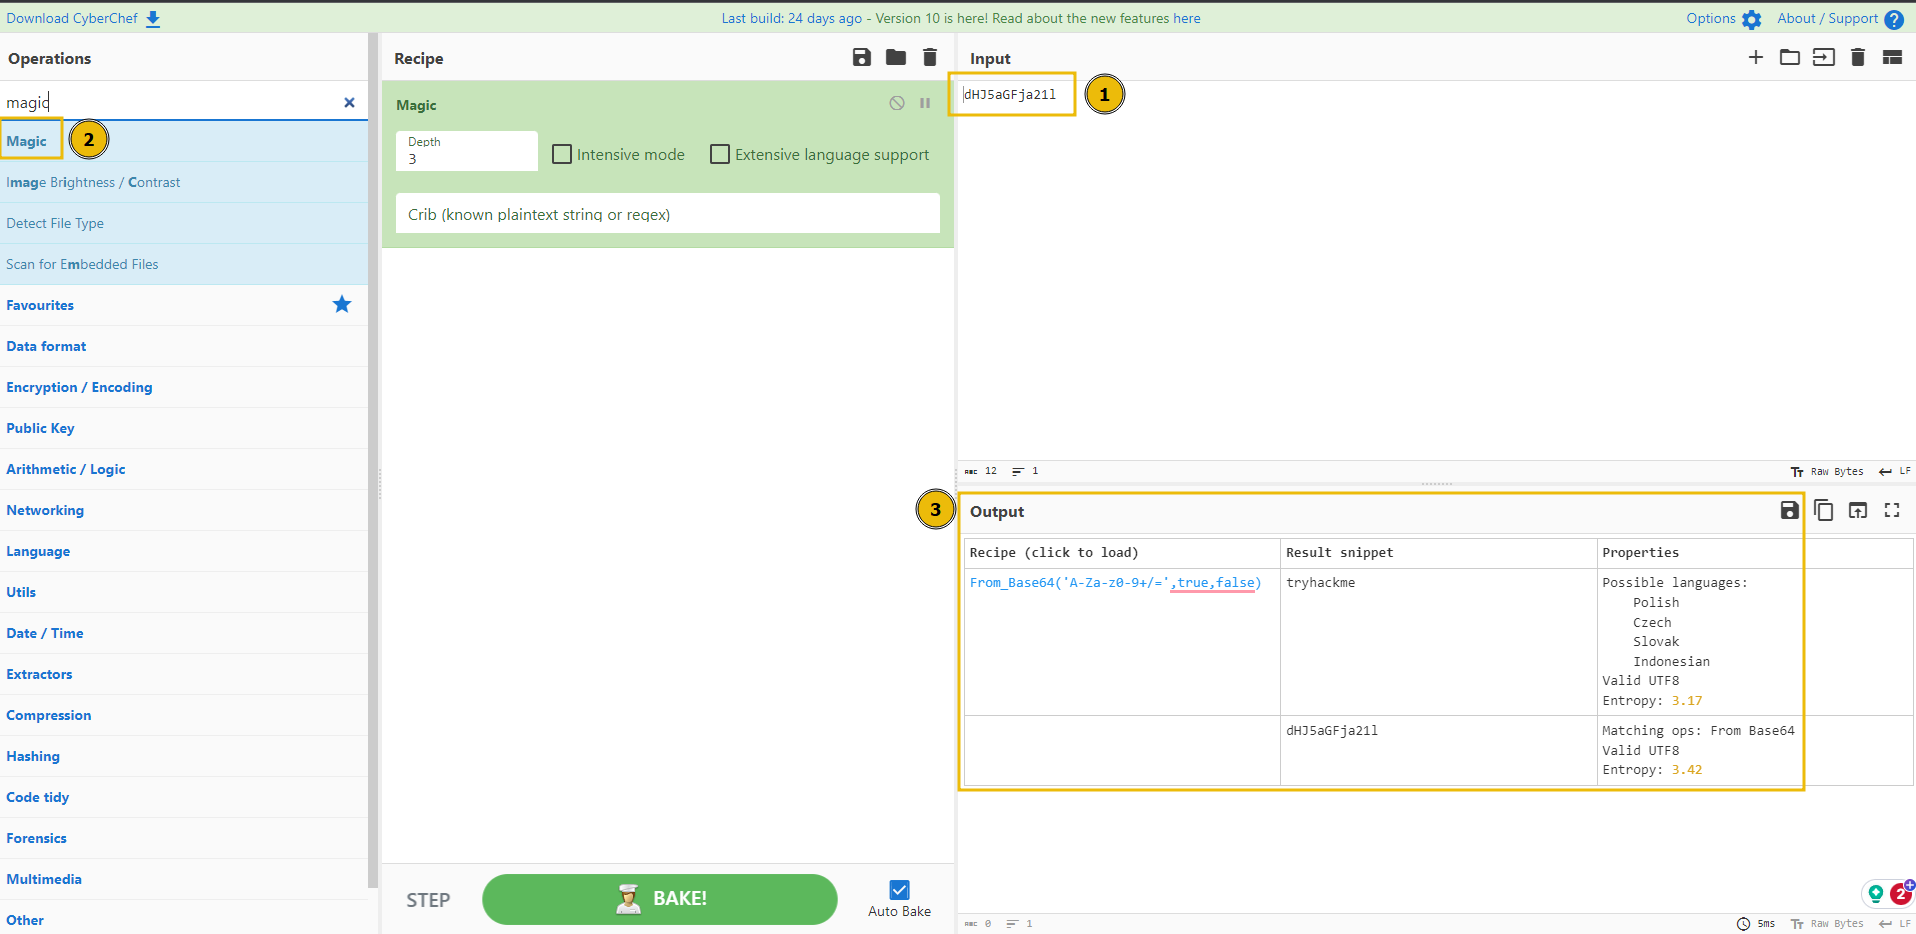
Note, if you are unsure what encoding an input is, you can use CyberChef’s “Magic” operation to take its best guess at what the input is and what operations may be of use here.
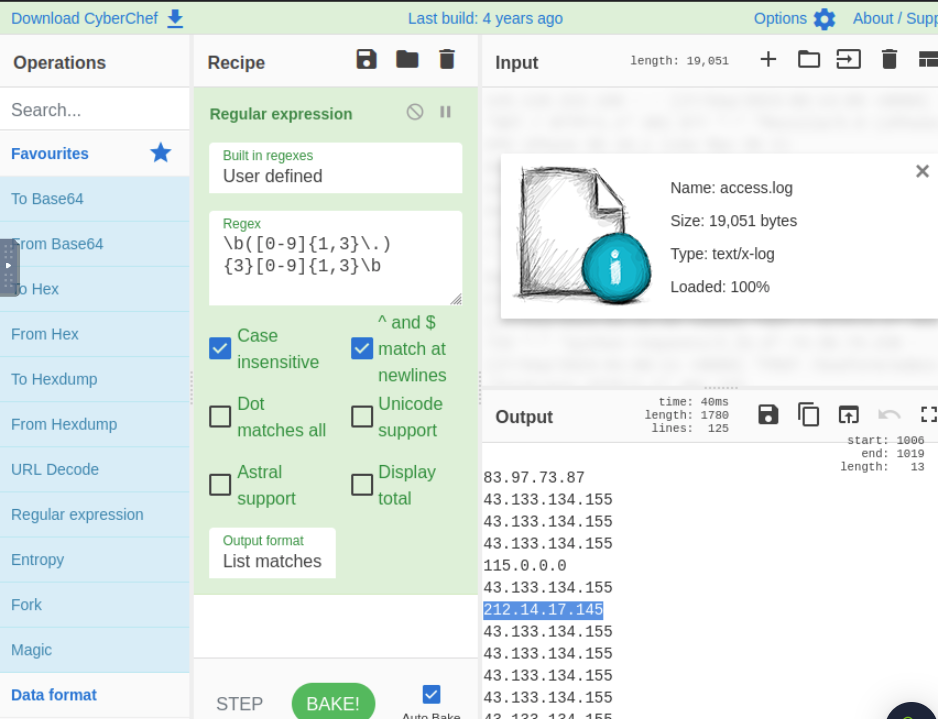
Regex with CyberChef
Recall from this room that regular expressions are a great way of searching and matching data. In this example, we are taking a log file that has captured SSH authentication attempts, and we are using regex to output all of the IP addresses that have attempted to authenticate.
Additionally, we are using the regex pattern \b([0-9]{1,3}\.){3}[0-9]{1,3}\b to search for values that are IP addresses:
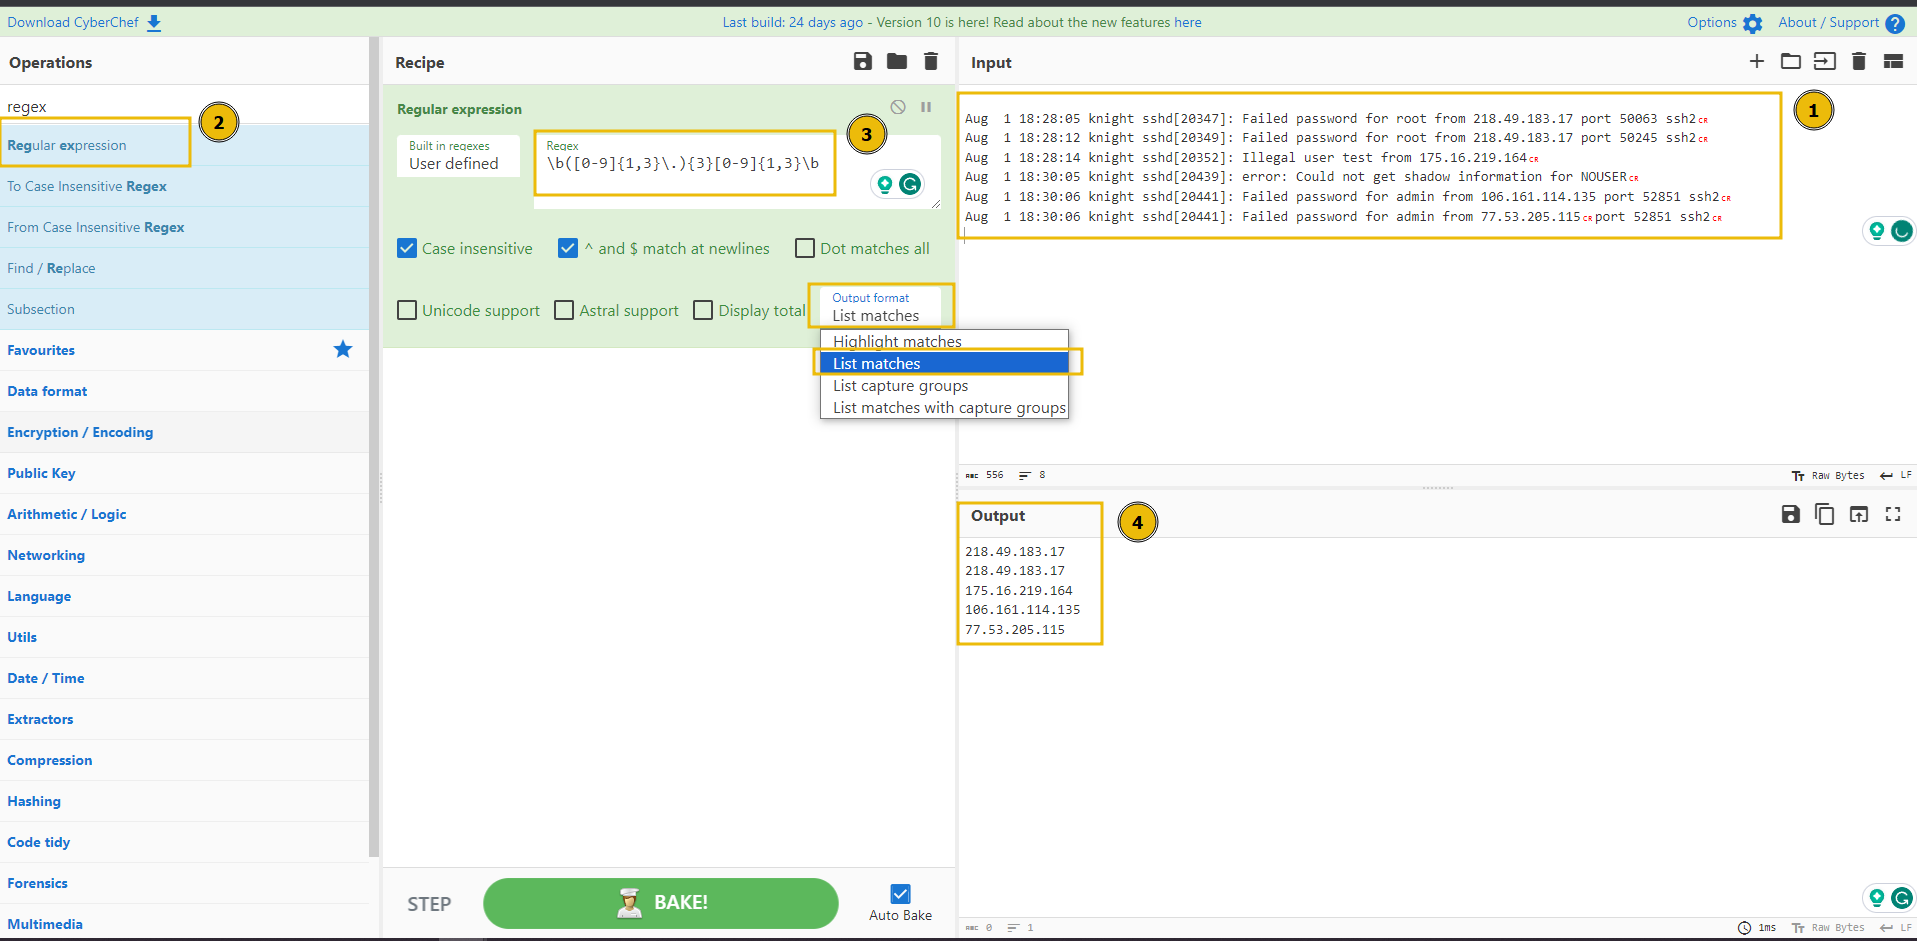
By selecting the "List matches" filter on the "Output format" of the operation, we can remove all of the noise from the log and output solely the IP addresses. Of course, this is a small example. Log files can often be hundreds of lines long.
Uploading Files in CyberChef
Files and folders can be uploaded to CyberChef. This provides a convenient way of uploading log files to CyberChef. To do so, click on the box with an arrow pointing inside it. Additionally, CyberChef has operators that allow you to unzip compressed files, such as .tar.gz or .zip.
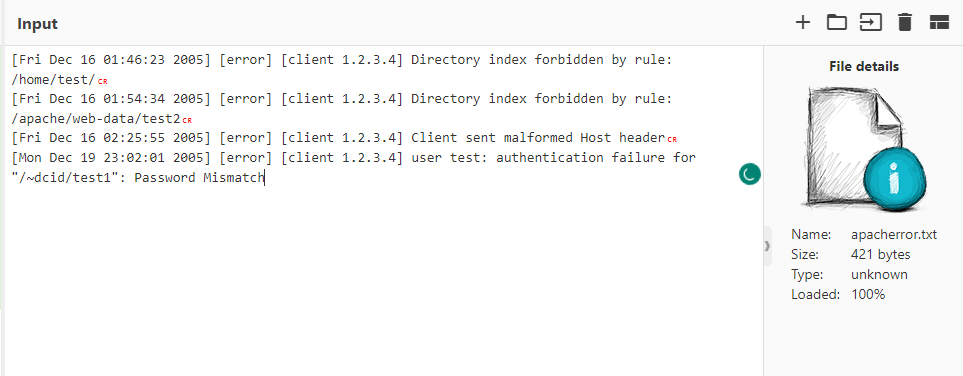
Locate the “loganalysis.zip” file under /root/Rooms/introloganalysis/task8 and extract the contents.
1
unzip filename.zip
- Upload the log file named “access.log” to CyberChef. Use regex to list all of the IP addresses. What is the full IP address beginning in 212?
1
\b([0-9]{1,3}\.){3}[0-9]{1,3}\b
1
Answer : 212.14.17.145
Using the same log file from Question #2, a request was made that is encoded in base64. What is the decoded value?
Answer : THM{CYBERCHEF_WIZARD}
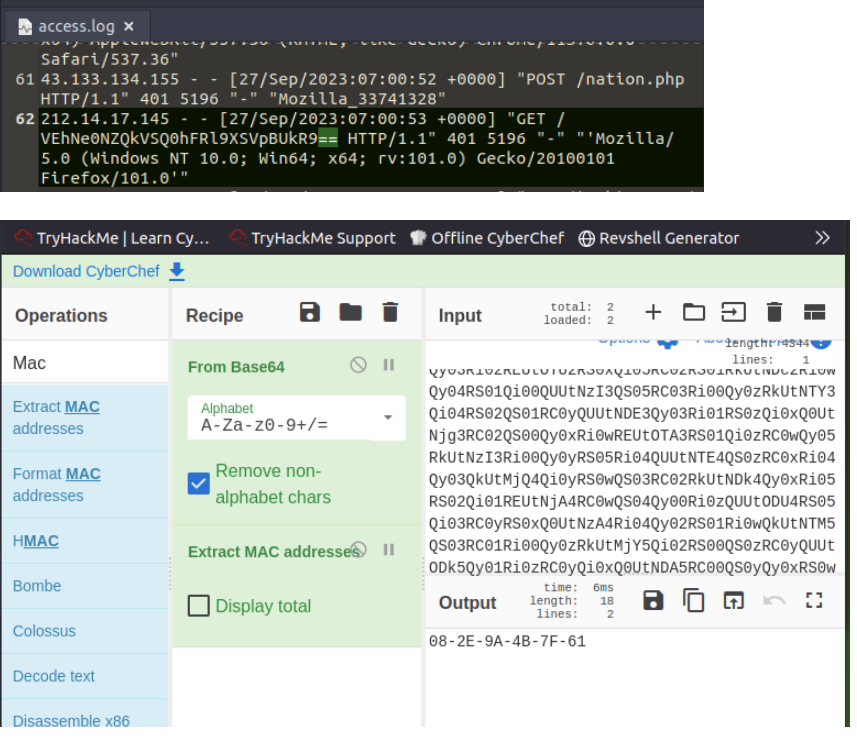
Using CyberChef, decode the file named “encodedflag.txt” and use regex to extract by MAC address. What is the extracted value?
Answer : 08-2E-9A-4B-7F-61
Task 9 - Log Analysis Tools: Yara and Sigma
Sigma
Sigma is a highly flexible open-source tool that describes log events in a structured format. Sigma can be used to find entries in log files using pattern matching. Sigma is used to:
- Detect events in log files
- Create SIEM searches
- Identify threats
Sigma uses the YAML syntax for its rules. This task will demonstrate Sigma being used to detect failed login events in SSH. Please note that writing a Sigma rule is out-of-scope for this room. However, let’s break down an example Sigma rule for the scenario listed above:
1
2
3
4
5
6
7
8
9
10
11
12
13
14
15
16
17
title: Failed SSH Logins
description: Searches sshd logs for failed SSH login attempts
status: experimental
author: CMNatic
logsource:
    product: linux
    service: sshd

detection:
    selection:
        type: 'sshd'
        a0|contains: 'Failed'
        a1|contains: 'Illegal'
    condition: selection
falsepositives:
    - Users forgetting or mistyping their credentials
level: medium
In this Sigma rule:
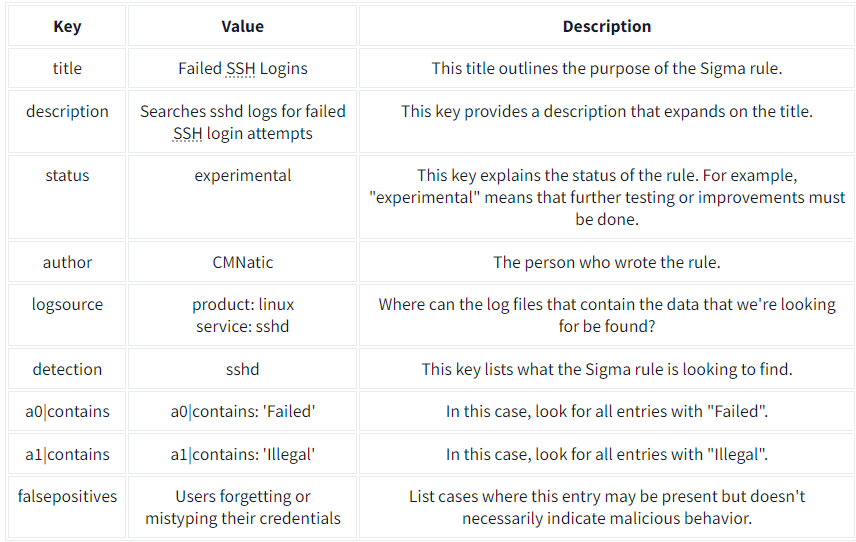
This rule can now be used in SIEM platforms to identify events in the processed logs. If you want to learn more about Sigma, I recommend checking out the Sigma room on TryHackMe.
Yara
Yara is another pattern-matching tool that holds its place in an analyst’s arsenal. Yara is a YAML-formatted tool that identifies information based on binary and textual patterns (such as hexadecimal and strings). While it is usually used in malware analysis, Yara is extremely effective in log analysis.
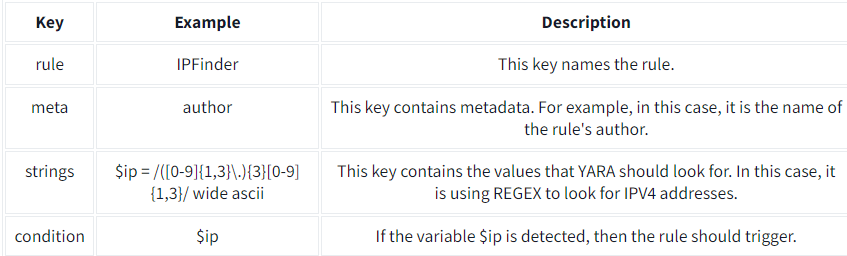
Let’s look at this example Yara rule called “IPFinder”. This YARA rule uses regex to search for any IPV4 addresses. If the log file we are analyzing contains an IP address, YARA will flag it:
1
2
3
4
5
6
7
8
9
rule IPFinder {
    meta:
        author = "CMNatic"
    strings:
        $ip = /([0-9]{1,3}\.){3}[0-9]{1,3}/ wide ascii

    condition:
        $ip
}
Let’s look at the keys that make up this Yara rule:
Using YARA to detect a specific IP address
1
2
cmnatic@thm:~$ yara ipfinder.yar apache2.txt
IPFinder apache2
This YARA rule can be expanded to look for:
- Multiple IP addresses
- IP Addresses based on a range (for example, an ASN or a subnet)
- IP addresses in HEX
- If an IP address lists more than a certain amount (I.e., alert if an IP address is found five times)
- And combined with other rules. For example, if an IP address visits a specific page or does a certain action
If you want to learn more about Yara, check out the Yara room on TryHackMe.
What languages does Sigma use?
Answer : YAML
What keyword is used to denote the “title” of a Sigma rule?
Answer : Title
What keyword is used to denote the “name” of a rule in YARA?
Answer : Rule
Task 10 - Conclusion
In this room, we covered the basic methodology behind adopting an effective log analysis strategy. We explored the importance of log data collection, common attack patterns, and useful tools for the investigation and response processes.
Next Steps
For a hands-on log analysis challenge, check out the next room in this module: Log Factory (coming soon!). To expand your SIEM and centralized logging solution capabilities, visit the Advanced Splunk and Advanced ELK modules.