THM: Active Reconnaissance

Ref:
Task 1 Introduction
In the first room of the Network Security Module, we focused on passive reconnaissance. In this second room, we focus on active reconnaissance and the essential tools related to it. We learn to use a web browser to collect more information about our target. Moreover, we discuss using simple tools such as ping, traceroute, telnet, and nc to gather information about the network, system, and services.
As we learned in the previous room, passive reconnaissance lets you gather information about your target without any kind of direct engagement or connection. You are watching from afar or checking publicly available information.
Active reconnaissance requires you to make some kind of contact with your target. This contact can be a phone call or a visit to the target company under some pretence to gather more information, usually as part of social engineering. Alternatively, it can be a a direct connection to the target system, whether visiting their website or checking if their firewall has an SSH port open. Think of it like you are closely inspecting windows and door locks. Hence, it is essential to remember not to engage in active reconnaissance work before getting signed legal authorization from the client.
In this room, we focus on active reconnaissance. Active reconnaissance begins with direct connections made to the target machine. Any such connection might leave information in the logs showing the client IP address, time of the connection, and duration of the connection, among other things. However, not all connections are suspicious. It is possible to let your active reconnaissance appear as regular client activity. Consider web browsing; no one would suspect a browser connected to a target web server among hundreds of other legitimate users. You can use such techniques to your advantage when working as part of the red team (attackers) and don’t want to alarm the blue team (defenders).
In this room, we go through various tools commonly bundled with most operating systems or easily obtainable. We begin with the web browser and its built-in developer tools; furthermore, we show you how a web browser can be “armed” to become an efficient reconnaissance framework. Afterwards, we discuss other benign tools such as ping, traceroute, and telnet. All these programs require connection to the target, and hence our activities would fall under active reconnaissance.
This room is of interest to anyone who wants to become familiar with essential tools and see how they can use them in active reconnaissance. The web browser developer tools might take some effort to gain familiarity, although it offers a graphical user interface. The command-line tools covered are relatively straightforward to use.
Important Notice: Please note that if you’re not subscribed, the AttackBox won’t have Internet access, so you will need to use the VPN to complete the questions that require Internet access.
Task 2 Web Browser The web browser can be a convenient tool, especially that it is readily available on all systems. There are several ways where you can use a web browser to gather information about a target.
On the transport level, the browser connects to:
- TCP port 80 by default when the website is accessed over HTTP
- TCP port 443 by default when the website is accessed over HTTPS
Since 80 and 443 are default ports for HTTP and HTTPS, the web browser does not show them in the address bar. However, it is possible to use custom ports to access a service. For instance,
1
https://127.0.0.1:8834/
will connect to 127.0.0.1 (localhost) at port 8834 via HTTPS protocol. If there is an HTTPS server listening on that port, we will receive a web page.
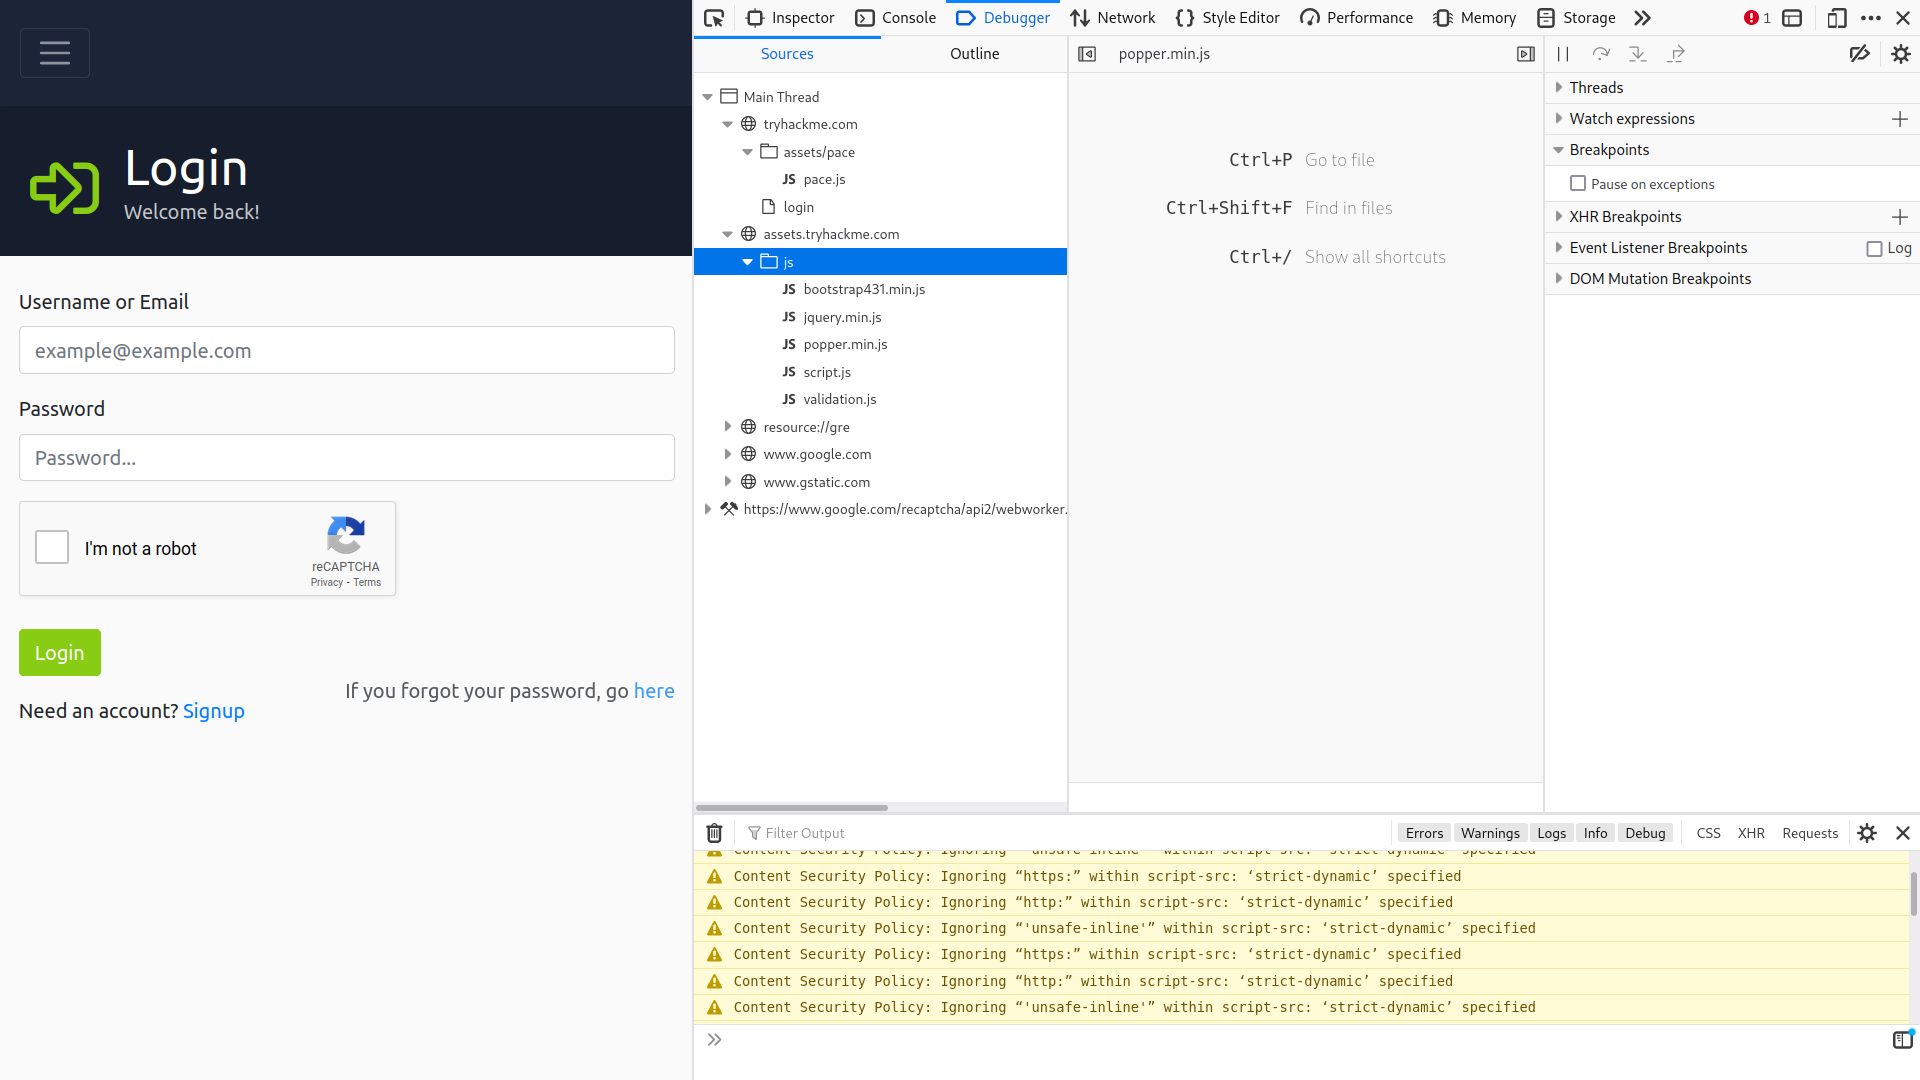
While browsing a web page, you can press Ctrl+Shift+Ion a PC or Option + Command + I (⌥ + ⌘ + I) on a Mac to open the Developer Tools on Firefox. Similar shortcuts will also get you started with Google Chrome or Chromium. Developer Tools lets you inspect many things that your browser has received and exchanged with the remote server. For instance, you can view and even modify the JavaScript (JS) files, inspect the cookies set on your system and discover the folder structure of the site content.
Below is a screenshot of Firefox Developer Tools. Chrome DevTools is quite similar.
here are also plenty of add-ons for Firefox and Chrome that can help in penetration testing. Here are a few examples:
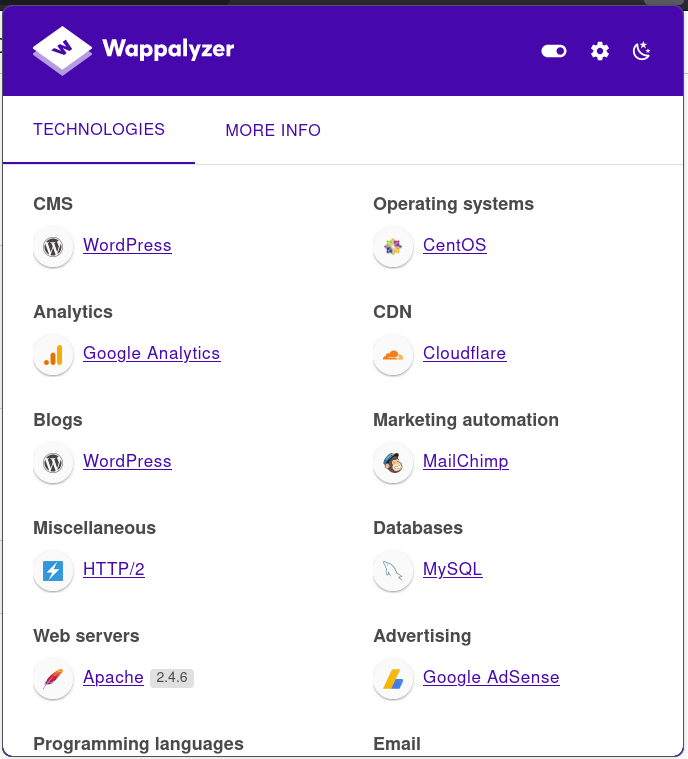
FoxyProxylets you quickly change the proxy server you are using to access the target website. This browser extension is convenient when you are using a tool such as Burp Suite or if you need to switch proxy servers regularly. You can get FoxyProxy forFirefoxfrom here.User-Agent Switcher and Managergives you the ability to pretend to be accessing the webpage from a different operating system or different web browser. In other words, you can pretend to be browsing a site using an iPhone when in fact, you are accessing it from Mozilla Firefox. You can download User-Agent Switcher and Manager for Firefox here.Wappalyzerprovides insights about the technologies used on the visited websites. Such extension is handy, primarily when you collect all this information while browsing the website like any other user. A screenshot of Wappalyzer is shown below. You can find Wappalyzer for Firefox here.
Over time, you might find a few extensions that fit perfectly in your workflow.
Browse to the following website and ensure that you have opened your Developer Tools on AttackBox Firefox, or the browser on your computer. Using the Developer Tools, figure out the total number of questions.
Answer: 8
Task 3 Ping
Ping should remind you of the game ping-pong (table tennis). You throw the ball and expect to get it back. The primary purpose of ping is to check whether you can reach the remote system and that the remote system can reach you back. In other words, initially, this was used to check network connectivity; however, we are more interested in its different uses: checking whether the remote system is online.
In simple terms, the ping command sends a packet to a remote system, and the remote system replies. This way, you can conclude that the remote system is online and that the network is working between the two systems.
If you prefer a pickier definition, the ping is a command that sends an ICMP Echo packet to a remote system. If the remote system is online, and the ping packet was correctly routed and not blocked by any firewall, the remote system should send back an ICMP Echo Reply. Similarly, the ping reply should reach the first system if appropriately routed and not blocked by any firewall.
The objective of such a command is to ensure that the target system is online before we spend time carrying out more detailed scans to discover the running operating system and services.
On your AttackBox terminal, you can start to use ping as
1
ping MACHINE_IP or ping HOSTNAME.
In the latter, the system needs to resolve HOSTNAME to an IP address before sending the ping packet. If you don’t specify the count on a Linux system, you will need to hit CTRL+cto force it to stop. Hence, you might consider
1
ping -c 10 MACHINE_IP
if you just want to send ten packets. This is equivalent to
1
ping -n 10 MACHINE_IP
on a MS Windows system.
Technically speaking, ping falls under the protocol ICMP (Internet Control Message Protocol). ICMP supports many types of queries, but, in particular, we are interested in ping (ICMP echo/type 8) and ping reply (ICMP echo reply/type 0). Getting into ICMP details is not required to use ping.
In the following example, we have specified the total count of packets to 5. From the AttackBox’s terminal, we started pinging MACHINE_IP. We learned that MACHINE_IP is up and is not blocking ICMP echo requests. Moreover, any firewalls and routers on the packet route are not blocking ICMP echo requests either.
AttackBox Terminal
1
2
3
4
5
6
7
8
9
10
11
user@AttackBox$ ping -c 5 MACHINE_IP
PING MACHINE_IP (MACHINE_IP) 56(84) bytes of data.
64 bytes from MACHINE_IP: icmp_seq=1 ttl=64 time=0.636 ms
64 bytes from MACHINE_IP: icmp_seq=2 ttl=64 time=0.483 ms
64 bytes from MACHINE_IP: icmp_seq=3 ttl=64 time=0.396 ms
64 bytes from MACHINE_IP: icmp_seq=4 ttl=64 time=0.416 ms
64 bytes from MACHINE_IP: icmp_seq=5 ttl=64 time=0.445 ms

--- MACHINE_IP ping statistics ---
5 packets transmitted, 5 received, 0% packet loss, time 4097ms
rtt min/avg/max/mdev = 0.396/0.475/0.636/0.086 ms
In the example above, we saw clearly that the target system is responding. The ping output is an indicator that it is online and reachable. We have transmitted five packets, and we received five replies. We notice that, on average, it took 0.475 ms (millisecond) for the reply to reach our system, with the maximum being 0.636 ms.
From a penetration testing point of view, we will try to discover more about this target. We will try to learn as much as possible, for example, which ports are open and which services are running.
Let’s consider the following case: we shut down the target virtual machine and then tried to ping MACHINE_IP. As you would expect in the following example, we don’t receive any reply.
AttackBox Terminal
1
2
3
4
5
6
7
8
9
10
11
user@AttackBox$ ping -c 5 MACHINE_IP
PING MACHINE_IP (MACHINE_IP) 56(84) bytes of data.
From ATTACKBOX_IP icmp_seq=1 Destination Host Unreachable
From ATTACKBOX_IP icmp_seq=2 Destination Host Unreachable
From ATTACKBOX_IP icmp_seq=3 Destination Host Unreachable
From ATTACKBOX_IP icmp_seq=4 Destination Host Unreachable
From ATTACKBOX_IP icmp_seq=5 Destination Host Unreachable

--- MACHINE_IP ping statistics ---
5 packets transmitted, 0 received, +5 errors, 100% packet loss, time 4098ms
pipe 4
In this case, we already know that we have shut down the target computer that has MACHINE_IP. For each ping, the system we are using, AttackBox in this case, is responding with “Destination Host Unreachable.” We can see that we have transmitted five packets, but none was received, resulting in a 100% packet loss.
Generally speaking, when we don’t get a ping reply back, there are a few explanations that would explain why we didn’t get a ping reply, for example:
The destination computer is not responsive; possibly still booting up or turned off, or the OS has crashed.
It is unplugged from the network, or there is a faulty network device across the path.
- A firewall is configured to block such packets. The firewall might be a piece of software running on the system itself or a separate network appliance. Note that MS Windows firewall blocks ping by default.
- Your system is unplugged from the network.
Which option would you use to set the size of the data carried by the ICMP echo request?
Windows
1
2
3
4
5
6
7
8
9
10
11
12
13
14
15
16
17
18
19
20
21
22
23
24
25
26
27
28
29
30
31
32
33
ping/?
---
Usage: ping [-t] [-a] [-n count] [-l size] [-f] [-i TTL] [-v TOS]
            [-r count] [-s count] [[-j host-list] | [-k host-list]]
            [-w timeout] [-R] [-S srcaddr] [-c compartment] [-p]
            [-4] [-6] target_name

Options:
    -t             Ping the specified host until stopped.
                   To see statistics and continue - type Control-Break;
                   To stop - type Control-C.
    -a             Resolve addresses to hostnames.
    -n count       Number of echo requests to send.
    -l size        Send buffer size.
    -f             Set Don't Fragment flag in packet (IPv4-only).
    -i TTL         Time To Live.
    -v TOS         Type Of Service (IPv4-only. This setting has been deprecated
                   and has no effect on the type of service field in the IP
                   Header).
    -r count       Record route for count hops (IPv4-only).
    -s count       Timestamp for count hops (IPv4-only).
    -j host-list   Loose source route along host-list (IPv4-only).
    -k host-list   Strict source route along host-list (IPv4-only).
    -w timeout     Timeout in milliseconds to wait for each reply.
    -R             Use routing header to test reverse route also (IPv6-only).
                   Per RFC 5095 the use of this routing header has been
                   deprecated. Some systems may drop echo requests if
                   this header is used.
    -S srcaddr     Source address to use.
    -c compartment Routing compartment identifier.
    -p             Ping a Hyper-V Network Virtualization provider address.
    -4             Force using IPv4.
    -6             Force using IPv6.
Linux
1
2
3
4
5
6
7
8
9
10
11
12
13
14
15
16
17
18
19
20
21
22
23
24
25
man ping
---
PING(8)                System Manager's Manual: iputils                PING(8)

NAME
       ping - send ICMP ECHO_REQUEST to network hosts

SYNOPSIS
       ping [-aAbBdDfhLnOqrRUvV46] [-c count] [-F flowlabel] [-i interval] [-I
       interface] [-l  preload]  [-m  mark]  [-M  pmtudisc_option]  [-N  node\u2010
       info_option] [-w deadline] [-W timeout] [-p pattern] [-Q tos] [-s pack\u2010
       etsize] [-S sndbuf] [-t ttl] [-T timestamp option] [hop  ...]  destina\u2010
       tion

DESCRIPTION
       ping uses the ICMP protocol's mandatory ECHO_REQUEST datagram to elicit
       an ICMP ECHO_RESPONSE from a host or gateway.   ECHO_REQUEST  datagrams
       (``pings'')  have  an  IP and ICMP header, followed by a struct timeval
       and then an arbitrary number of ``pad'' bytes  used  to  fill  out  the
       packet.

       ping  works  with both IPv4 and IPv6. Using only one of them explicitly
       can be enforced by specifying -4 or -6.

       ping can also send IPv6 Node Information Queries (RFC4620).  Intermedi\u2010
What is the size of the ICMP header in bytes?
1
8 bytes
Does MS Windows Firewall block ping by default? (Y/N)
1
Y
Deploy the VM for this task and using the AttackBox terminal, issue the command ping -c 10 MACHINE_IP. How many ping replies did you get back?
1
10
Task 4 Traceroute
As the name suggests, the traceroute command traces the route taken by the packets from your system to another host. The purpose of a traceroute is to find the IP addresses of the routers or hops that a packet traverses as it goes from your system to a target host. This command also reveals the number of routers between the two systems. It is helpful as it indicates the number of hops (routers) between your system and the target host. However, note that the route taken by the packets might change as many routers use dynamic routing protocols that adapt to network changes.
On Linux and macOS, the command to use is traceroute 10.10.35.66, and on MS Windows, it is tracert 10.10.35.66. traceroute tries to discover the routers across the path from your system to the target system.
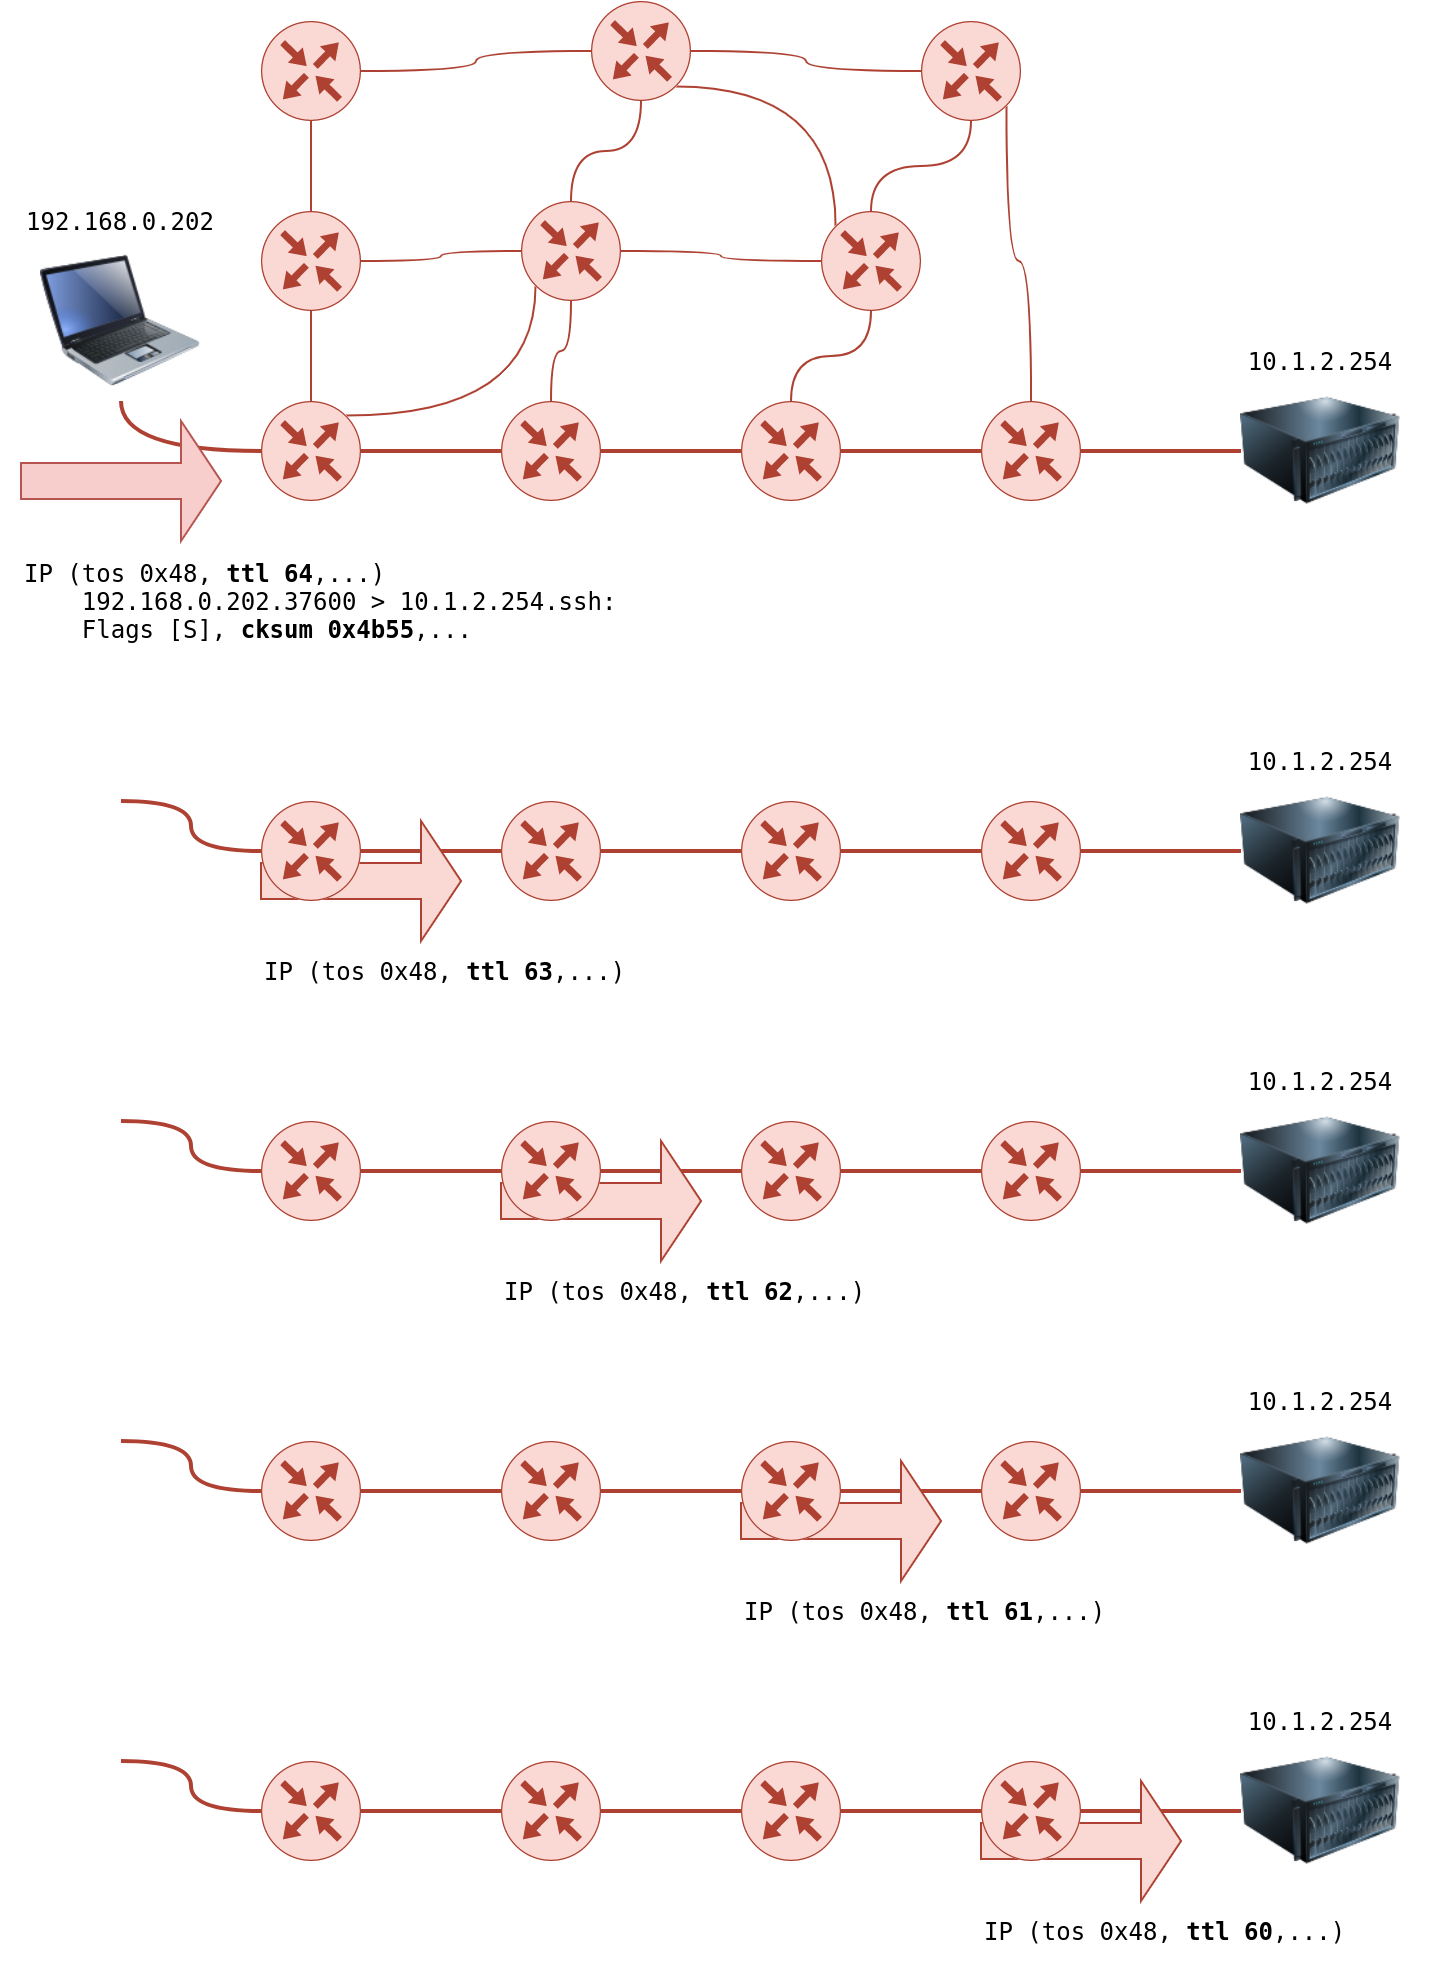
There is no direct way to discover the path from your system to a target system. We rely on ICMP to “trick” the routers into revealing their IP addresses. We can accomplish this by using a small Time To Live (TTL) in the IP header field. Although the T in TTL stands for time, TTL indicates the maximum number of routers/hops that a packet can pass through before being dropped; TTL is not a maximum number of time units. When a router receives a packet, it decrements the TTL by one before passing it to the next router. The following figure shows that each time the IP packet passes through a router, its TTL value is decremented by 1. Initially, it leaves the system with a TTL value of 64; it reaches the target system with a TTL value of 60 after passing through 4 routers.
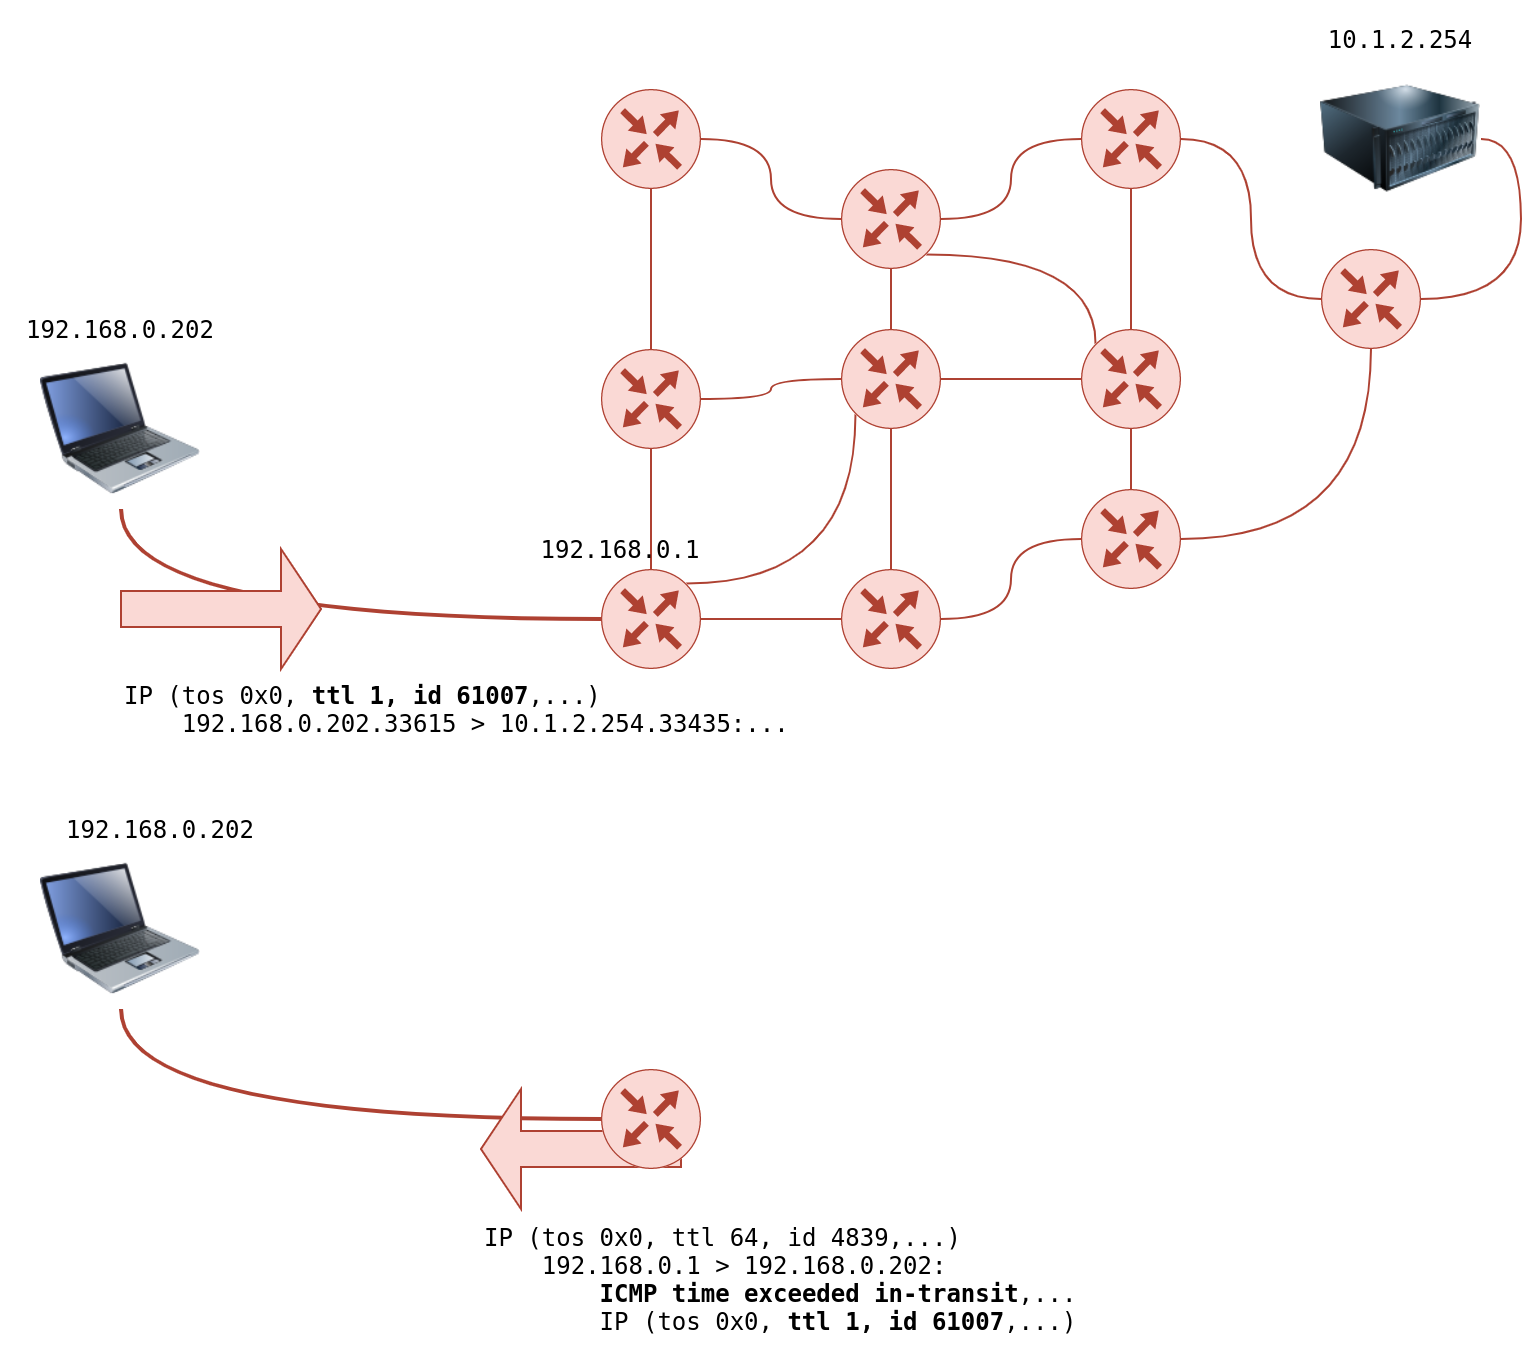
However, if the TTL reaches 0, it will be dropped, and an ICMP Time-to-Live exceeded would be sent to the original sender. In the following figure, the system set TTL to 1 before sending it to the router. The first router on the path decrements the TTL by 1, resulting in a TTL of 0. Consequently, this router will discard the packet and send an ICMP time exceeded in-transit error message. Note that some routers are configured not to send such ICMP messages when discarding a packet.
On Linux, traceroute will start by sending UDP datagrams within IP packets of TTL being 1. Thus, it causes the first router to encounter a TTL=0 and send an ICMP Time-to-Live exceeded back. Hence, a TTL of 1 will reveal the IP address of the first router to you. Then it will send another packet with TTL=2; this packet will be dropped at the second router. And so on. Let’s try this on live systems.
In the following examples, we run the same command, traceroute tryhackme.com from TryHackMe’s AttackBox. We notice that different runs might lead to different routes taken by the packets.
Traceroute A
AttackBox Terminal - Traceroute A
1
2
3
4
5
6
7
8
9
10
11
12
13
14
15
16
user@AttackBox$ traceroute tryhackme.com
traceroute to tryhackme.com (172.67.69.208), 30 hops max, 60 byte packets
 1  ec2-3-248-240-5.eu-west-1.compute.amazonaws.com (3.248.240.5)  2.663 ms * ec2-3-248-240-13.eu-west-1.compute.amazonaws.com (3.248.240.13)  7.468 ms
 2  100.66.8.86 (100.66.8.86)  43.231 ms 100.65.21.64 (100.65.21.64)  18.886 ms 100.65.22.160 (100.65.22.160)  14.556 ms
 3  * 100.66.16.176 (100.66.16.176)  8.006 ms *
 4  100.66.11.34 (100.66.11.34)  17.401 ms 100.66.10.14 (100.66.10.14)  23.614 ms 100.66.19.236 (100.66.19.236)  17.524 ms
 5  100.66.7.35 (100.66.7.35)  12.808 ms 100.66.6.109 (100.66.6.109)  14.791 ms *
 6  100.65.14.131 (100.65.14.131)  1.026 ms 100.66.5.189 (100.66.5.189)  19.246 ms 100.66.5.243 (100.66.5.243)  19.805 ms
 7  100.65.13.143 (100.65.13.143)  14.254 ms 100.95.18.131 (100.95.18.131)  0.944 ms 100.95.18.129 (100.95.18.129)  0.778 ms
 8  100.95.2.143 (100.95.2.143)  0.680 ms 100.100.4.46 (100.100.4.46)  1.392 ms 100.95.18.143 (100.95.18.143)  0.878 ms
 9  100.100.20.76 (100.100.20.76)  7.819 ms 100.92.11.36 (100.92.11.36)  18.669 ms 100.100.20.26 (100.100.20.26)  0.842 ms
10  100.92.11.112 (100.92.11.112)  17.852 ms * 100.92.11.158 (100.92.11.158)  16.687 ms
11  100.92.211.82 (100.92.211.82)  19.713 ms 100.92.0.126 (100.92.0.126)  18.603 ms 52.93.112.182 (52.93.112.182)  17.738 ms
12  99.83.69.207 (99.83.69.207)  17.603 ms  15.827 ms  17.351 ms
13  100.92.9.83 (100.92.9.83)  17.894 ms 100.92.79.136 (100.92.79.136)  21.250 ms 100.92.9.118 (100.92.9.118)  18.166 ms
14  172.67.69.208 (172.67.69.208)  17.976 ms  16.945 ms 100.92.9.3 (100.92.9.3)  17.709 ms
In the traceroute output above, we have 14 numbered lines; each line represents one router/hop. Our system sends three packets with TTL set to 1, then three packets with TTL set to 2, and so forth. Depending on the network topology, we might get replies from up to 3 different routers, depending on the route taken by the packet. Consider line number 12, the twelfth router with the listed IP address has dropped the packet three times and sent an ICMP time exceeded in-transit message. The line 12 99.83.69.207 (99.83.69.207) 17.603 ms 15.827 ms 17.351 ms shows the time in milliseconds for each reply to reach our system.
On the other hand, we can see that we received only a single reply on the third line. The two stars in the output 3 * 100.66.16.176 (100.66.16.176) 8.006 ms * indicate that our system didn’t receive two expected ICMP time exceeded in-transit messages.
Finally, in the first line of the output, we can see that the packets leaving the AttackBox take different routes. We can see two routers that responded to TTL being one. Our system never received the third expected ICMP message.
Traceroute B
AttackBox Terminal - Traceroute B
1
2
3
4
5
6
7
8
9
10
11
12
13
14
15
16
17
18
19
20
21
22
23
24
25
26
27
28
user@AttackBox$ traceroute tryhackme.com
traceroute to tryhackme.com (104.26.11.229), 30 hops max, 60 byte packets
 1  ec2-79-125-1-9.eu-west-1.compute.amazonaws.com (79.125.1.9)  1.475 ms * ec2-3-248-240-31.eu-west-1.compute.amazonaws.com (3.248.240.31)  9.456 ms
 2  100.65.20.160 (100.65.20.160)  16.575 ms 100.66.8.226 (100.66.8.226)  23.241 ms 100.65.23.192 (100.65.23.192)  22.267 ms
 3  100.66.16.50 (100.66.16.50)  2.777 ms 100.66.11.34 (100.66.11.34)  22.288 ms 100.66.16.28 (100.66.16.28)  4.421 ms
 4  100.66.6.47 (100.66.6.47)  17.264 ms 100.66.7.161 (100.66.7.161)  39.562 ms 100.66.10.198 (100.66.10.198)  15.958 ms
 5  100.66.5.123 (100.66.5.123)  20.099 ms 100.66.7.239 (100.66.7.239)  19.253 ms 100.66.5.59 (100.66.5.59)  15.397 ms
 6  * 100.66.5.223 (100.66.5.223)  16.172 ms 100.65.15.135 (100.65.15.135)  0.424 ms
 7  100.65.12.135 (100.65.12.135)  0.390 ms 100.65.12.15 (100.65.12.15)  1.045 ms 100.65.14.15 (100.65.14.15)  1.036 ms
 8  100.100.4.16 (100.100.4.16)  0.482 ms 100.100.20.122 (100.100.20.122)  0.795 ms 100.95.2.143 (100.95.2.143)  0.827 ms
 9  100.100.20.86 (100.100.20.86)  0.442 ms 100.100.4.78 (100.100.4.78)  0.347 ms 100.100.20.20 (100.100.20.20)  1.388 ms
10  100.92.212.20 (100.92.212.20)  11.611 ms 100.92.11.54 (100.92.11.54)  12.675 ms 100.92.11.56 (100.92.11.56)  10.835 ms
11  100.92.6.52 (100.92.6.52)  11.427 ms 100.92.6.50 (100.92.6.50)  11.033 ms 100.92.210.50 (100.92.210.50)  10.551 ms
12  100.92.210.139 (100.92.210.139)  10.026 ms 100.92.6.13 (100.92.6.13)  14.586 ms 100.92.210.69 (100.92.210.69)  12.032 ms
13  100.92.79.12 (100.92.79.12)  12.011 ms 100.92.79.68 (100.92.79.68)  11.318 ms 100.92.80.84 (100.92.80.84)  10.496 ms
14  100.92.9.27 (100.92.9.27)  11.354 ms 100.92.80.31 (100.92.80.31)  13.000 ms 52.93.135.125 (52.93.135.125)  11.412 ms
15  150.222.241.85 (150.222.241.85)  9.660 ms 52.93.135.81 (52.93.135.81)  10.941 ms 150.222.241.87 (150.222.241.87)  16.543 ms
16  100.92.228.102 (100.92.228.102)  15.168 ms 100.92.227.41 (100.92.227.41)  10.134 ms 100.92.227.52 (100.92.227.52)  11.756 ms
17  100.92.232.111 (100.92.232.111)  10.589 ms 100.92.231.69 (100.92.231.69)  16.664 ms 100.92.232.37 (100.92.232.37)  13.089 ms
18  100.91.205.140 (100.91.205.140)  11.551 ms 100.91.201.62 (100.91.201.62)  10.246 ms 100.91.201.36 (100.91.201.36)  11.368 ms
19  100.91.205.79 (100.91.205.79)  11.112 ms 100.91.205.83 (100.91.205.83)  11.040 ms 100.91.205.33 (100.91.205.33)  10.114 ms
20  100.91.211.45 (100.91.211.45)  9.486 ms 100.91.211.79 (100.91.211.79)  13.693 ms 100.91.211.47 (100.91.211.47)  13.619 ms
21  100.100.6.81 (100.100.6.81)  11.522 ms 100.100.68.70 (100.100.68.70)  10.181 ms 100.100.6.21 (100.100.6.21)  11.687 ms
22  100.100.65.131 (100.100.65.131)  10.371 ms 100.100.92.6 (100.100.92.6)  10.939 ms 100.100.65.70 (100.100.65.70)  23.703 ms
23  100.100.2.74 (100.100.2.74)  15.317 ms 100.100.66.17 (100.100.66.17)  11.492 ms 100.100.88.67 (100.100.88.67)  35.312 ms
24  100.100.16.16 (100.100.16.16)  19.155 ms 100.100.16.28 (100.100.16.28)  19.147 ms 100.100.2.68 (100.100.2.68)  13.718 ms
25  99.83.89.19 (99.83.89.19)  28.929 ms *  21.790 ms
26  104.26.11.229 (104.26.11.229)  11.070 ms  11.058 ms  11.982 ms
In the second run of the traceroute program, we noticed that the packets took a longer route this time, passing through 26 routers. If you are running a traceroute to a system within your network, the route will be unlikely to change. However, we cannot expect the route to remain fixed when the packets need to go via other routers outside our network.
To summarize, we can notice the following:
The number of hops/routers between your system and the target system depends on the time you are running traceroute. There is no guarantee that your packets will always follow the same route, even if you are on the same network or you repeat the traceroute command within a short time.
Some routers return a public IP address. You might examine a few of these routers based on the scope of the intended penetration testing.
Some routers don’t return a reply.
In Traceroute A, what is the IP address of the last router/hop before reaching tryhackme.com?
1
172.67.69.208
In Traceroute B, what is the IP address of the last router/hop before reaching tryhackme.com?
1
104.26.11.229
In Traceroute B, how many routers are between the two systems?
1
26
Start the attached VM from Task 3 if it is not already started. On the AttackBox, run traceroute MACHINE_IP. Check how many routers/hops are there between the AttackBox and the target VM.
Task 5 Telnet
The TELNET (Teletype Network) protocol was developed in 1969 to communicate with a remote system via a command-line interface (CLI). Hence, the command telnet uses the TELNET protocol for remote administration. The default port used by telnet is 23. From a security perspective, telnet sends all the data, including usernames and passwords, in cleartext. Sending in cleartext makes it easy for anyone, who has access to the communication channel, to steal the login credentials. The secure alternative is SSH (Secure SHell) protocol.
However, the telnet client, with its simplicity, can be used for other purposes. Knowing that telnet client relies on the TCP protocol, you can use Telnet to connect to any service and grab its banner. Using telnet MACHINE_IP PORT, you can connect to any service running on TCP and even exchange a few messages unless it uses encryption.
Let’s say we want to discover more information about a web server, listening on port 80. We connect to the server at port 80, and then we communicate using the HTTP protocol. You don’t need to dive into the HTTP protocol; you just need to issue GET / HTTP/1.1. To specify something other than the default index page, you can issue GET /page.html HTTP/1.1, which will request page.html. We also specified to the remote web server that we want to use HTTP version 1.1 for communication. To get a valid response, instead of an error, you need to input some value for the host host: example and hit enter twice. Executing these steps will provide the requested index page.
Pentester Terminal
1
telnet MACHINE_IP 80
1
2
3
4
5
6
7
8
9
10
11
12
13
14
15
16
17
18
19
Trying MACHINE_IP...
Connected to MACHINE_IP.
Escape character is '^]'.
GET / HTTP/1.1
host: telnet

HTTP/1.1 200 OK
Server: nginx/1.6.2
Date: Tue, 17 Aug 2021 11:13:25 GMT
Content-Type: text/html
Content-Length: 867
Last-Modified: Tue, 17 Aug 2021 11:12:16 GMT
Connection: keep-alive
ETag: "611b9990-363"
Accept-Ranges: bytes


...
Of particular interest for us is discovering the type and version of the installed web server, Server: nginx/1.6.2. In this example, we communicated with a web server, so we used basic HTTP commands. If we connect to a mail server, we need to use proper commands based on the protocol, such as SMTP and POP3.
Start the attached VM from Task 3 if it is not already started. On the AttackBox, open the terminal and use the telnet client to connect to the VM on port 80. What is the name of the running server?
1
2
3
4
5
6
root@ip-10-10-178-81:~# telnet 10.10.158.124 80
Trying 10.10.158.124...
Connected to 10.10.158.124.
Escape character is '^]'.
GET /HTTP/1.1
1
2
3
4
5
6
7
8
9
10
11
<!DOCTYPE HTML PUBLIC "-//IETF//DTD HTML 2.0//EN">
<html><head>
<title>404 Not Found</title>
</head><body>
<h1>Not Found</h1>
<p>The requested URL was not found on this server.</p>
<hr>
<address>Apache/2.4.10 (Debian) Server at debra2.thm.local Port 80</address>
</body></html>
Connection closed by foreign host.
1
Answer : Apache
What is the version of the running server (on port 80 of the VM)?
1
Answer : 2.4.10
Task 6 Netcat
Netcat or simply nc has different applications that can be of great value to a pentester. Netcat supports both TCP and UDP protocols. It can function as a client that connects to a listening port; alternatively, it can act as a server that listens on a port of your choice. Hence, it is a convenient tool that you can use as a simple client or server over TCP or UDP.
First, you can connect to a server, as you did with Telnet, to collect its banner using nc 10.10.133.220 PORT, which is quite similar to our previous telnet 10.10.133.220 PORT. Note that you might need to press SHIFT+ENTER after the GET line.
Pentester Terminal pentester@TryHackMe$ nc MACHINE_IP 80 GET / HTTP/1.1 host: netcat
HTTP/1.1 200 OK Server: nginx/1.6.2 Date: Tue, 17 Aug 2021 11:39:49 GMT Content-Type: text/html Content-Length: 867 Last-Modified: Tue, 17 Aug 2021 11:12:16 GMT Connection: keep-alive ETag: “611b9990-363” Accept-Ranges: bytes … In the terminal shown above, we used netcat to connect to 10.10.133.220 port 80 using
1
nc 10.10.133.220 80.
Next, we issued a get for the default page using GET / HTTP/1.1`; we are specifying to the target server that our client supports HTTP version 1.1.
Finally, we need to give a name to our host, so we added on a new line, host: netcat; you can name your host anything as this has no impact on this exercise.
Based on the output Server: nginx/1.6.2 we received, we can tell that on port 80, we have Nginx version 1.6.2 listening for incoming connections.
You can use netcat to listen on a TCP port and connect to a listening port on another system.
On the server system, where you want to open a port and listen on it, you can issue
1
nc -lp 1234
or better yet,
1
 nc -vnlp 1234
, which is equivalent to
1
 nc -v -l -n -p 1234
, as you would remember from the Linux room. The exact order of the letters does not matter as long as the port number is preceded directly by -p.
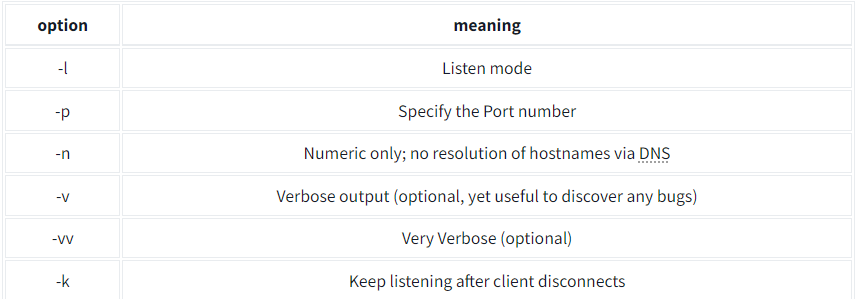
1
2
3
4
5
6
-l	Listen mode
-p	Specify the Port number
-n	Numeric only; no resolution of hostnames via DNS
-v	Verbose output (optional, yet useful to discover any bugs)
-vv	Very Verbose (optional)
-k	Keep listening after client disconnects
Notes:
the option -p should appear just before the port number you want to listen on.
the option -n will avoid DNS lookups and warnings.
port numbers less than 1024 require root privileges to listen on.
On the client-side, you would issue nc 10.10.133.190 PORT_NUMBER. Here is an example of using nc to echo. After you successfully establish a connection to the server, whatever you type on the client-side will be echoed on the server-side and vice versa.
Consider the following example. On the server-side, we will listen on port 1234. We can achieve this with the command
1
nc -vnlp PORT
1
nc -vnlp 1234 (same as nc -lvnp 1234)
In our case, the listening server has the IP address 10.10.133.190, so we can connect to it from the client-side by executing
1
nc 10.10.133.190 1234
This setup would echo whatever you type on one side to the other side of the TCP tunnel. You can find a recording of the process below. Note that the listening server is on the left side of the screen.
Start the VM and open the AttackBox. Once the AttackBox loads, use Netcat to connect to the VM port 21. What is the version of the running server?
1
nc 10.10.133.190 21
1
220 debra2.thm.local FTP server (Version 6.4/OpenBSD/Linux-ftpd-0.17) ready.
1
Answer: 0.17
Task 7 Putting It All Together
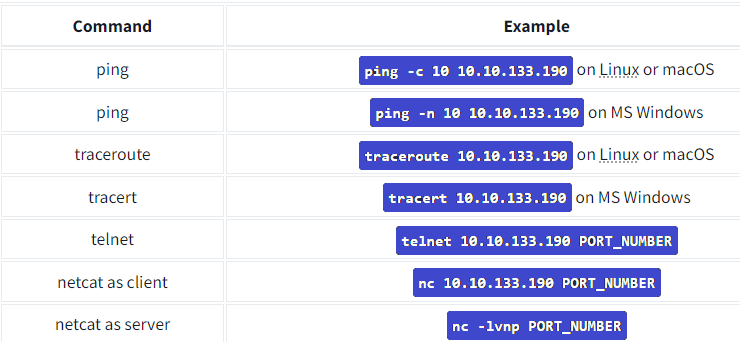
In this room, we have covered many various tools. It is easy to put a few of them together via a shell script to build a primitive network and system scanner. You can use traceroute to map the path to the target, ping to check if the target system responds to ICMP Echo, and telnet to check which ports are open and reachable by attempting to connect to them. Available scanners do this at much more advanced and sophisticated levels, as we will see in the next four rooms with nmap.
1
2
3
4
5
6
7
8
9
Command	Example
ping	ping -c 10 10.10.133.190 on Linux or macOS
ping	ping -n 10 10.10.133.190 on MS Windows
traceroute	traceroute 10.10.133.190 on Linux or macOS
tracert	tracert 10.10.133.190 on MS Windows
telnet	telnet 10.10.133.190 PORT_NUMBER
netcat as client	nc 10.10.133.190 PORT_NUMBER
netcat as server	nc -lvnp PORT_NUMBER
Although these are fundamental tools, they are readily available on most systems. In particular, a web browser is installed on practically every computer and smartphone and can be an essential tool in your arsenal for conducting reconnaissance without raising alarms. If you want to gain more profound knowledge of the Developer Tools, we recommend joining Walking An Application.
1
2
3
Operating System	Developer Tools Shortcut
Linux or MS Windows	Ctrl+Shift+I
macOS	Option + Command + I